Concurrency bugs are hard to diagnose with fmt.Println alone. Debugging gets far easier when you can see with your own eyes when a goroutine runs and when it blocks, and in what order data flows through channels. This article walks through Go's concurrency visualization and analysis tools with hands-on examples.
1. Why Visualize Concurrency Code
1.1 The Limits of fmt.Println Debugging
In sequential code, you can trace the execution flow by adding log lines one at a time. But in concurrent code, this approach often breaks down.
- Output order is not guaranteed: The execution order of goroutines is determined by the runtime scheduler, so the order in which logs are printed may differ from the order in which things actually happened.
- Heisenbug: Adding
fmt.Printlntriggers internal synchronization that shifts execution timing, which can make the bug disappear (a Heisenbug). - No causality: Logs alone make it hard to pin down a causal relationship like "goroutine A sent a value on the channel, and then goroutine B received it."
1.2 Comparing the Roles of Each Tool
| Tool | Type | Purpose | Overhead |
|---|---|---|---|
go tool trace | built-in | Full timeline, GC, blocking analysis | 1-2% CPU (Go 1.21+) |
GODEBUG=schedtrace | built-in | Quick check of scheduler state | Almost none |
gotraceui | third-party | Large traces, detailed goroutine analysis | None (viewer) |
divan/gotrace | third-party | Educational 3D visualization | High |
| Flight Recorder | built-in (Go 1.25) | Capturing anomalies in production | 2-10 MB/s memory |
2. go tool trace Basics
The runtime/trace package collects execution events of a Go program (goroutine creation/termination, scheduling, GC, syscalls, and so on). The collected data can be visualized in a browser with go tool trace.
2.1 Three Ways to Collect a trace
Method 1: Insert directly into the code
Use trace.Start and trace.Stop to precisely collect only the section you care about.
func TestBasicTrace_Start_Stop(t *testing.T) {
    // Persist to the tmp folder (unlike t.TempDir(), it survives after the test so go tool trace can analyze it)
    err := os.MkdirAll("tmp", 0o755)
    assert.NoError(t, err)

    f, err := os.Create("tmp/trace_basic.out")
    assert.NoError(t, err)
    defer func() { _ = f.Close() }()

    // Start collecting the trace
    err = rttrace.Start(f)
    assert.NoError(t, err)

    // Run concurrent work across several goroutines
    var wg sync.WaitGroup
    for i := range 5 {
        wg.Add(1)
        go func() {
            defer wg.Done()
            sum := 0
            for range 1_000_000 {
                sum++
            }
            t.Logf("goroutine %d: sum=%d", i, sum)
        }()
    }
    wg.Wait()

    // Stop collecting the trace
    rttrace.Stop()

    // Verify the trace file was created
    info, err := f.Stat()
    assert.NoError(t, err)
    assert.Positive(t, info.Size(), "the trace file should not be empty")
}
Using an alias with
import rttrace "runtime/trace"avoids a package-name collision with the standard library'sruntime/trace.
Method 2: the go test -trace flag
You can collect a trace during a test run without modifying any code.
go test -v -trace=trace.out ./golang/concurrency/trace/...
go tool trace trace.out
Method 3: HTTP endpoint (net/http/pprof)
Collect a trace from a running server via an HTTP request.
import _ "net/http/pprof"

// The pprof handlers are automatically registered on the default HTTP server
// curl -o trace.out http://localhost:6060/debug/pprof/trace?seconds=5
2.2 Analyzing a trace
You can open the collected trace file in a browser with the following command.
go tool trace tmp/trace_basic.out
Running the command starts a local web server (e.g. http://127.0.0.1:52022) and displays links to several analysis views in the browser. The actual screens and how to interpret each view are covered in detail in the next section.
3. Interpreting the Key Views of go tool trace
The screens in this section come from actually opening the trace of the earlier TestBasicTrace_Start_Stop (a CPU-bound workload where 5 goroutines each count to one million). We'll look at how to read each view based on this example.
First, the basics — Go's GMP scheduler model
To read the trace views you need to know the three components that make up the Go runtime scheduler. To run thousands of goroutines on a small number of OS threads, Go combines the following three.
Abbr. Full name What it is G Goroutine A lightweight unit of execution managed by Go (created with go func()). The work to be doneM Machine An actual OS thread. The worker that physically runs the code P Processor A logical processor. The scheduling context that distributes G's to M's (holds a local run queue). The workbench that hands out work For a goroutine (G) to run, an M acquires a P, takes a G off the P's local queue, and runs it on the M. The number of P's is set by
GOMAXPROCS(defaults to the number of CPU cores), and this becomes the upper bound on the number of goroutines that can actually run code simultaneously. This G/M/P concept is used again later when interpreting theschedtrace/scheddetailoutput in Section 5.
3.1 View Trace (Timeline)
The timeline view is the central view that shows every event in the program along the time axis. The overall trend graphs appear at the top, and bars per execution entity appear at the bottom.
- Heap: Memory allocation patterns. You can see the heap shrinking after GC
- Goroutines: the count of running vs. runnable (ready to run but waiting). A high runnable count means P's are scarce or there is scheduling contention
- OS Threads: the number of active threads. Many threads blocked on syscalls may indicate a network/disk I/O bottleneck
- PROCS: goroutine execution per P (Processor). GC STW (Stop-The-World) events are also visible here
The bottom of the timeline can be viewed by P (logical processor) or by OS thread (M).
View by proc — timeline per P
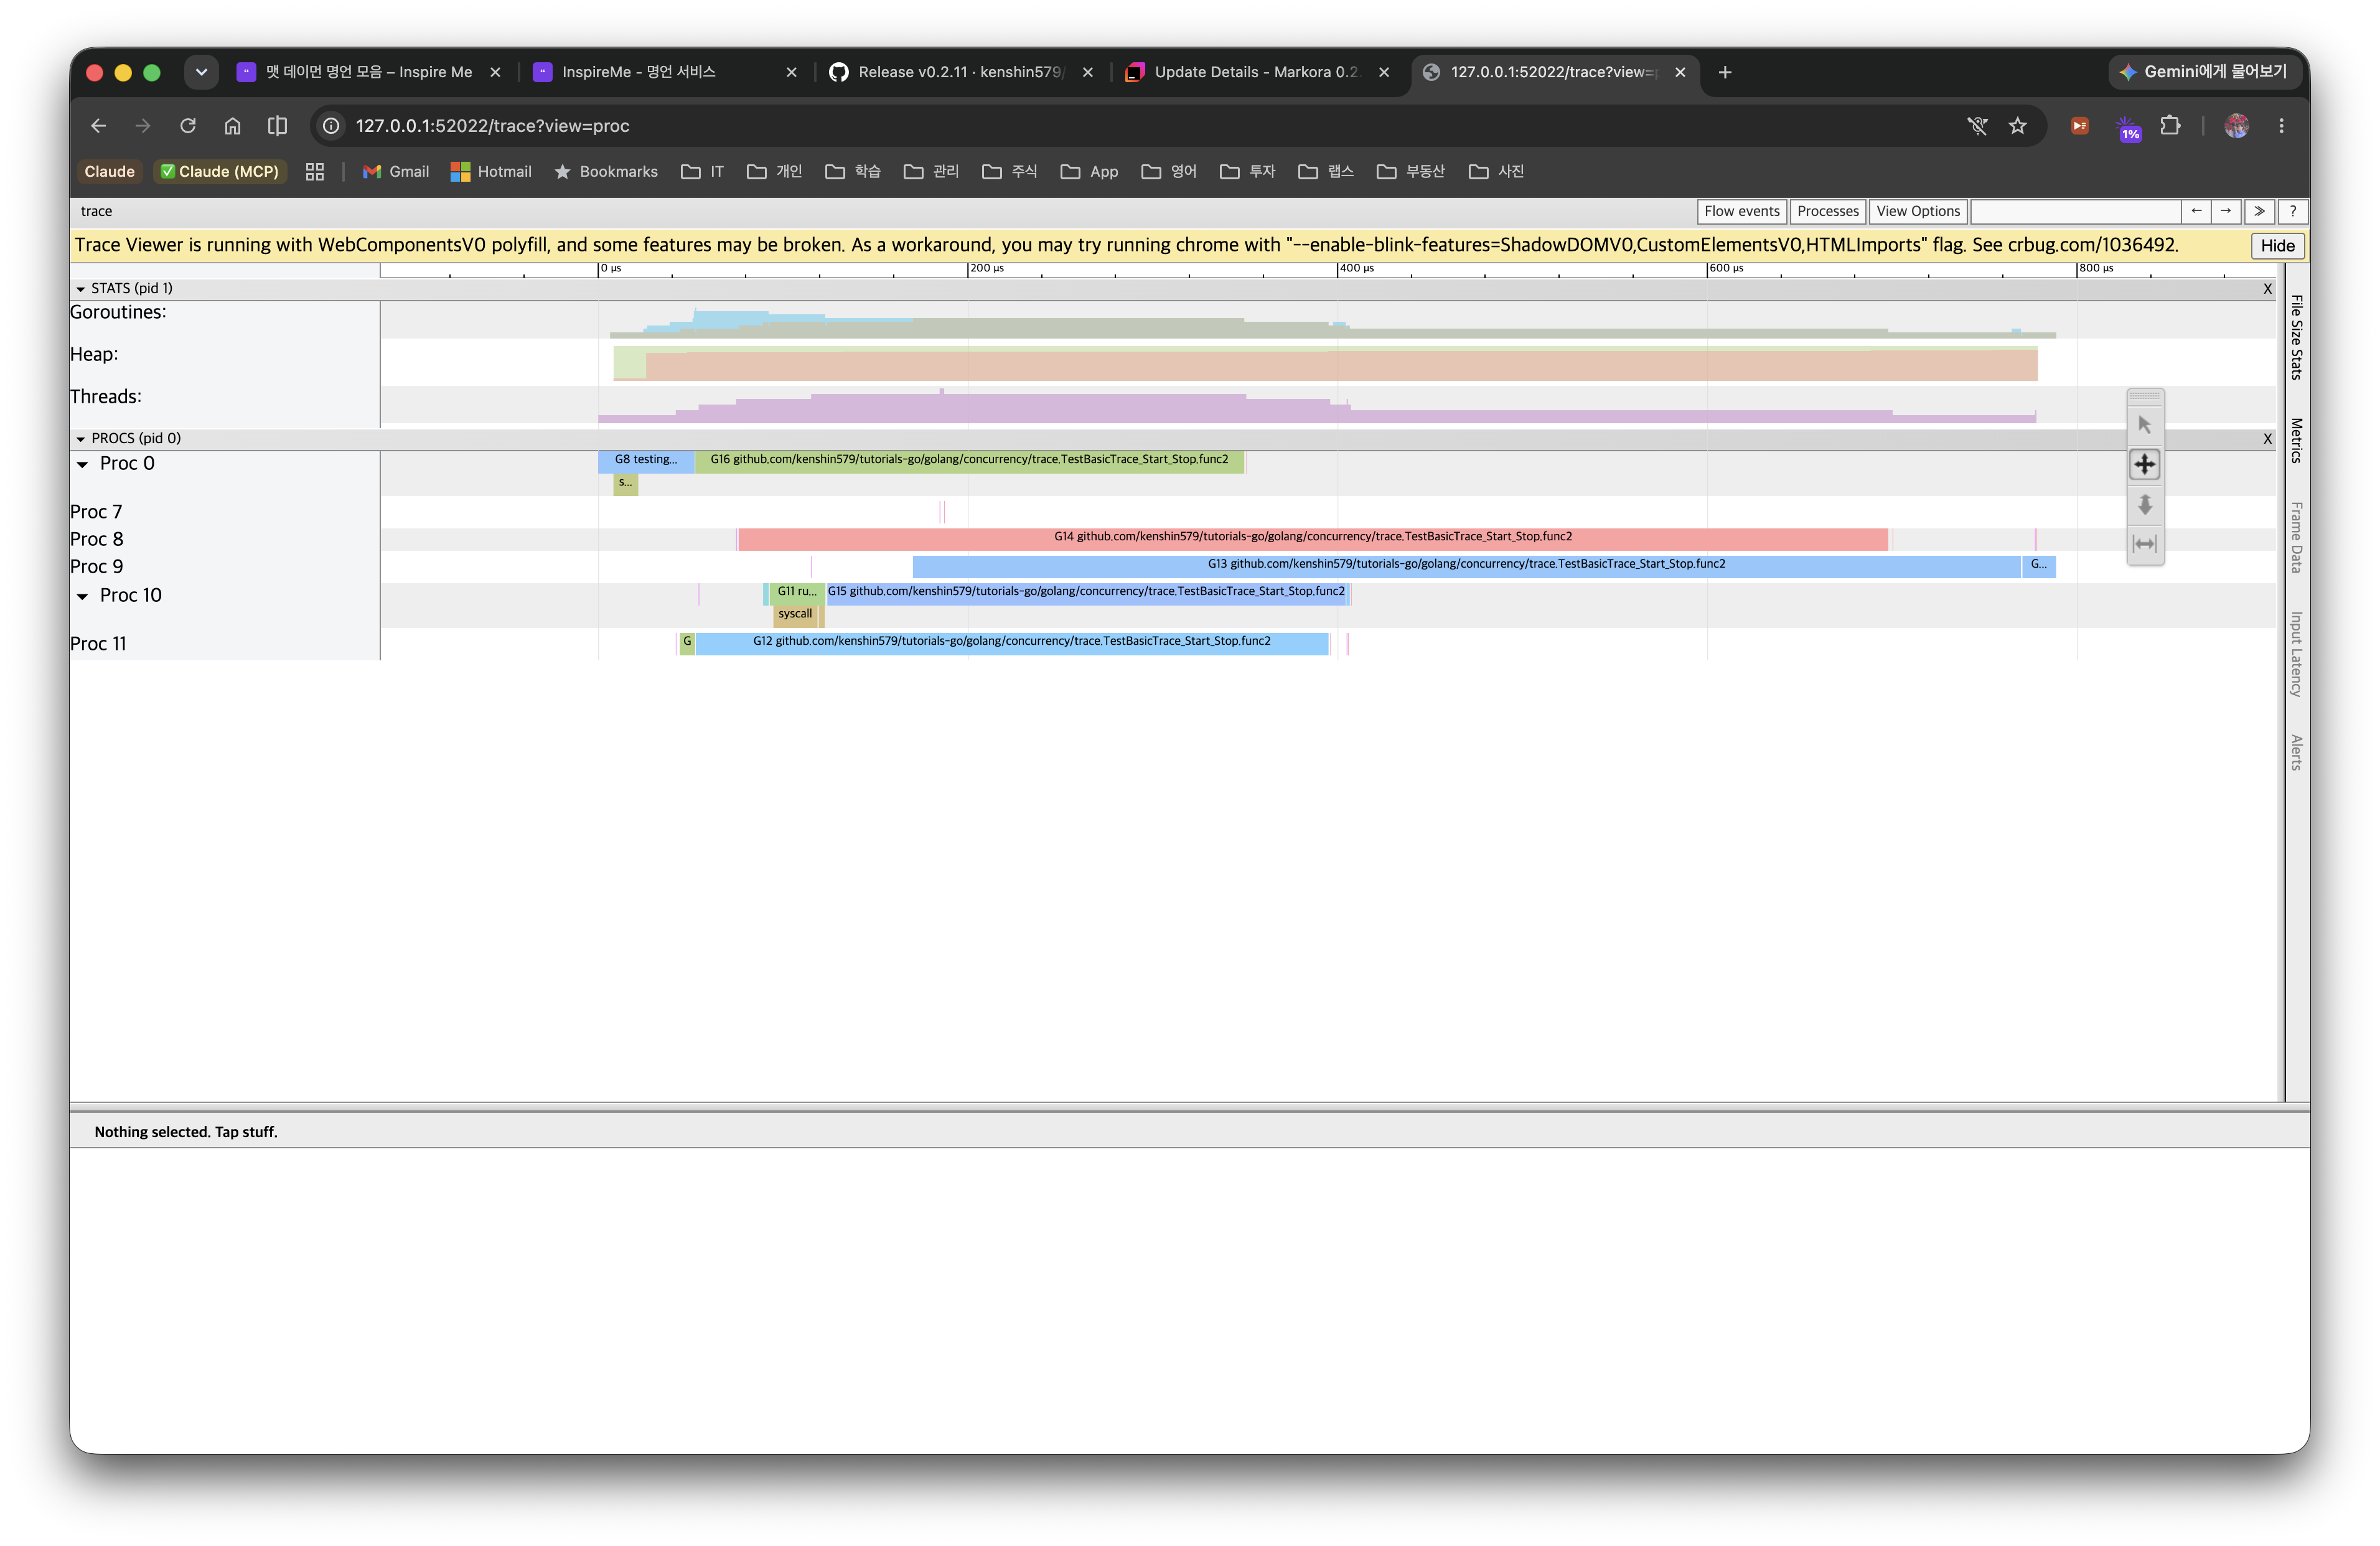
- The 5
TestBasicTrace_Start_Stop.func2bars are spread across different P's and run almost simultaneously → meaning multi-core parallelism is being used well. - The bars end quickly without being interrupted in the middle because the counting loop only uses the CPU without blocking.
- If bars pile up on a single P, or there are long empty (idle) gaps between bars, suspect load imbalance or scheduling contention.
View by thread — timeline per OS thread (M)
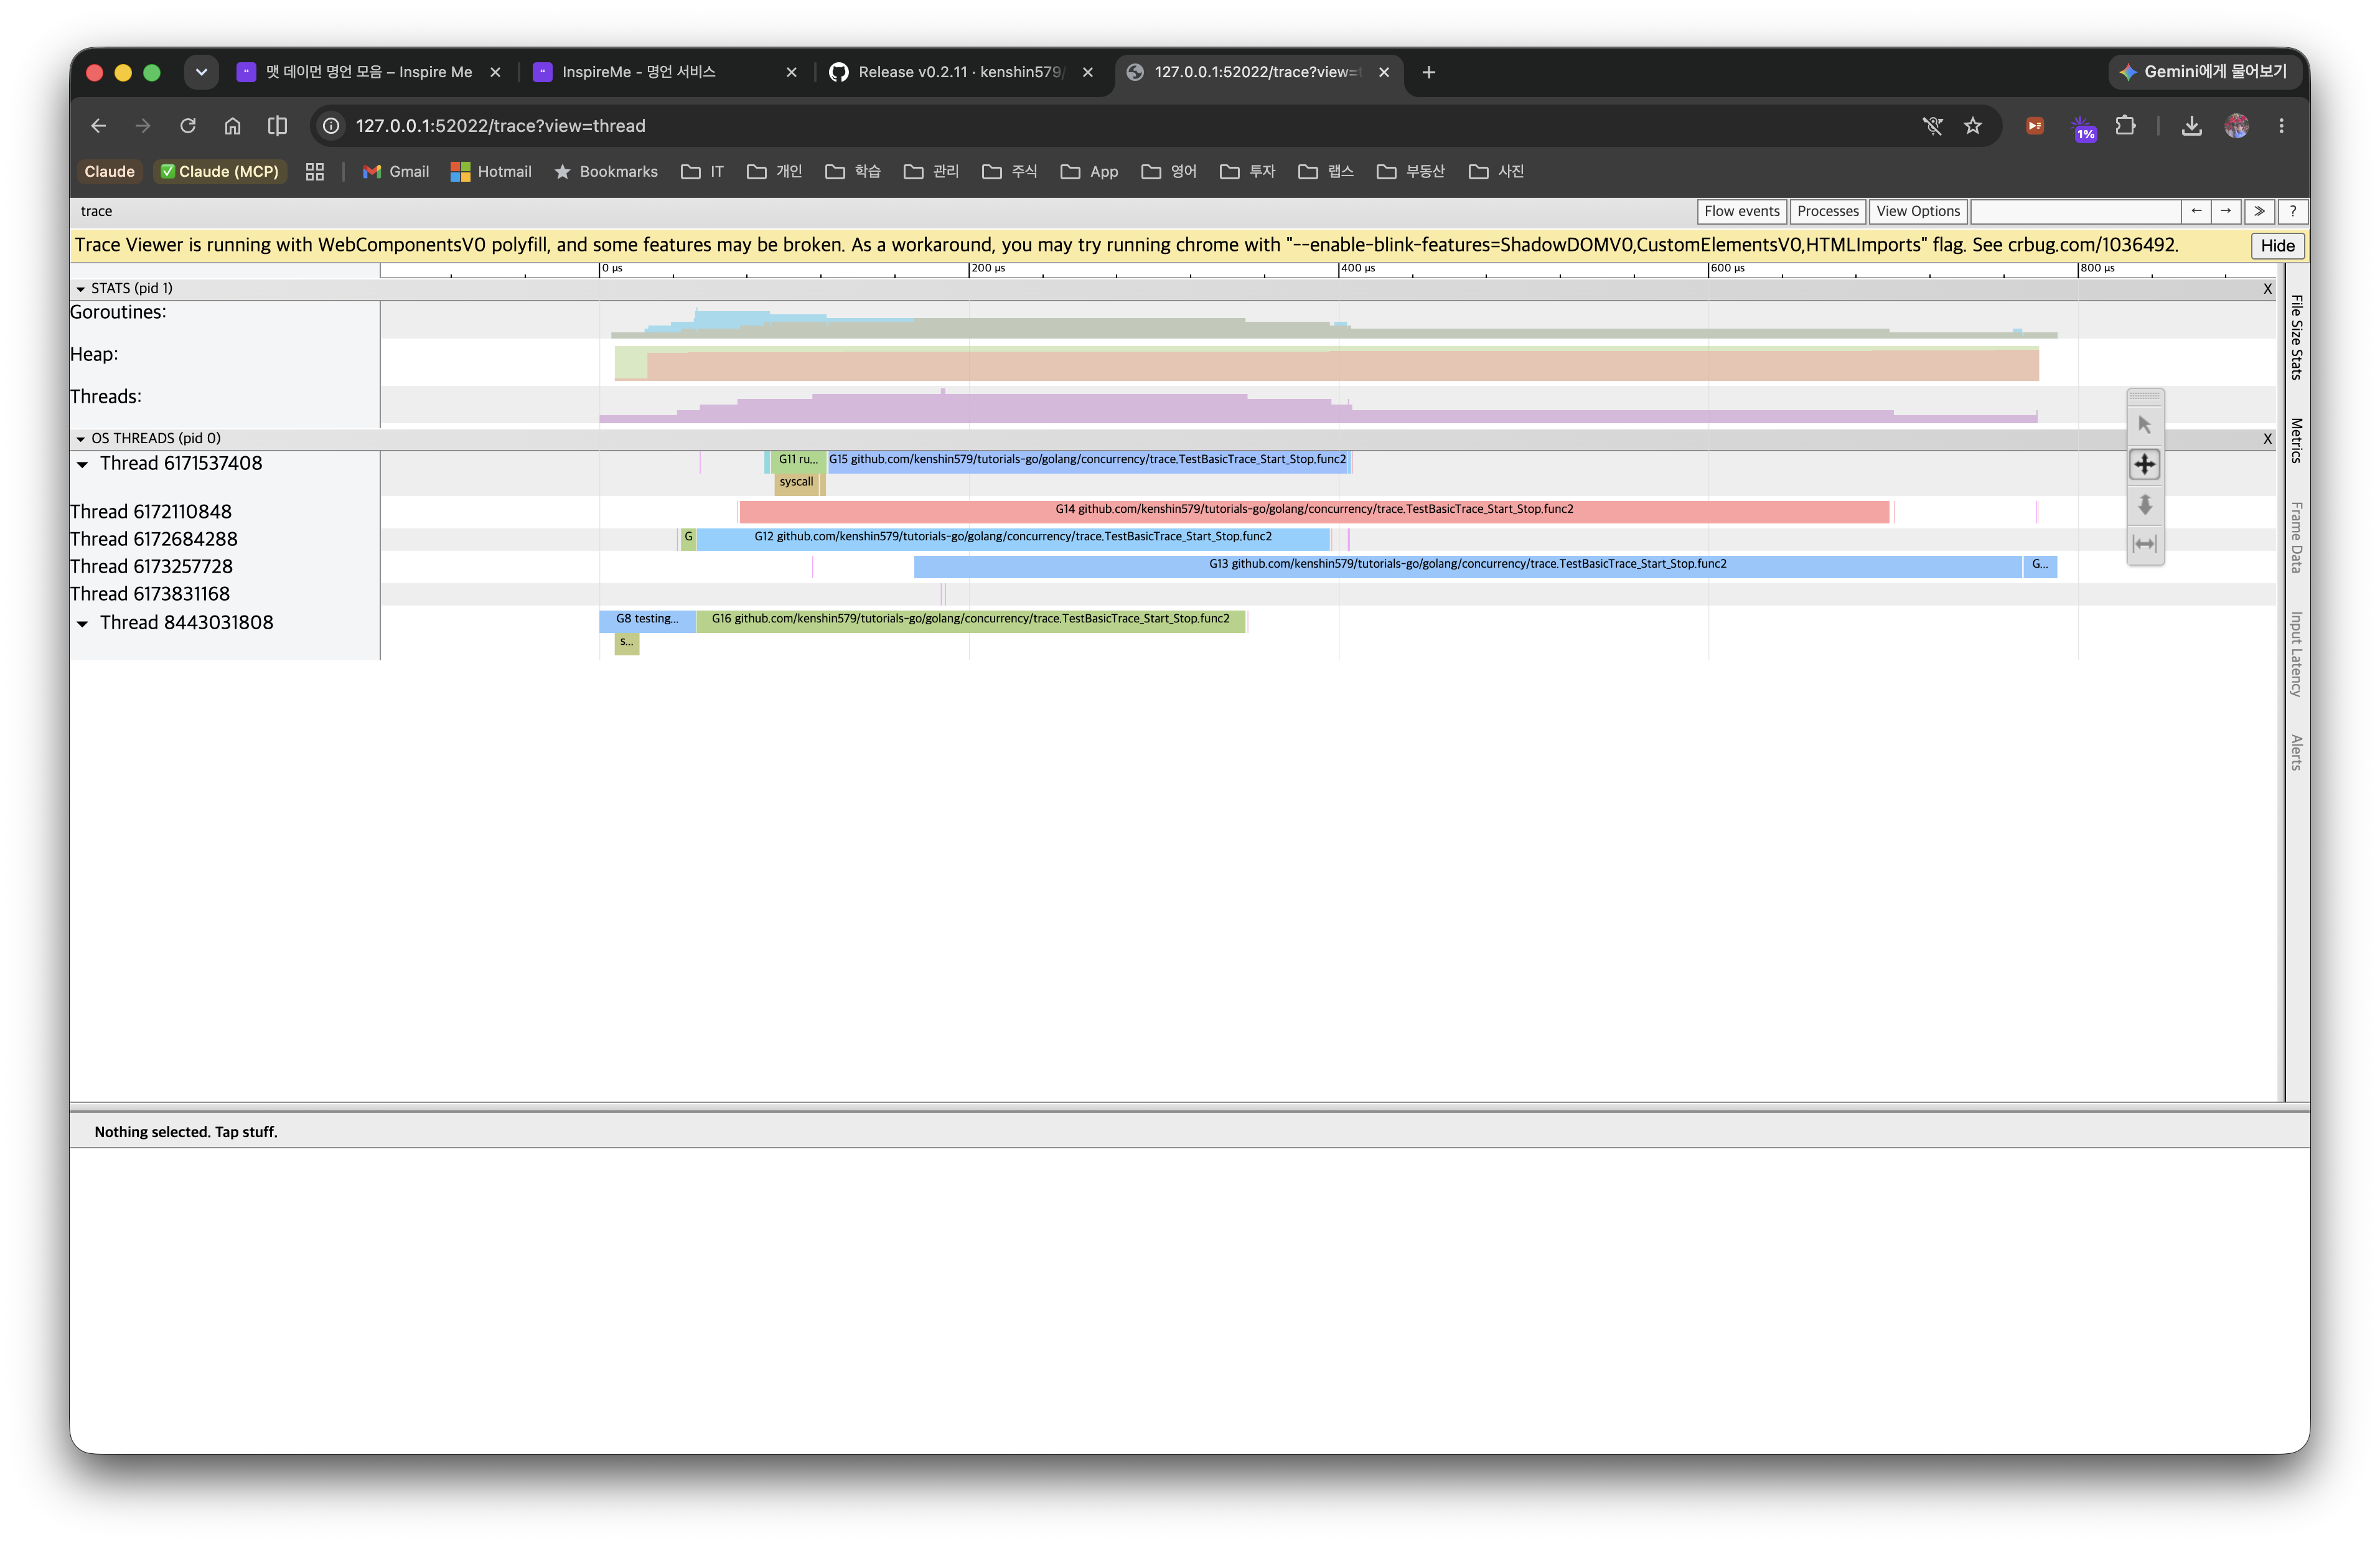
- This is the same execution viewed by OS thread (M) rather than by P (e.g.
Thread 6171537408). The segments markedsyscallare the time the thread was tied up in a system call. - Many long
syscallsegments suggest a network/disk I/O bottleneck, and a sudden surge in the number of threads (M) is a sign that the runtime is creating extra threads because of blocking syscalls. This example is pure CPU work, so there are almost no syscall segments.
3.2 Goroutine Analysis
This groups goroutines by type and shows their time distribution. First a summary table by start location appears, and clicking a group leads to a per-goroutine breakdown.
Summary — grouped by start location
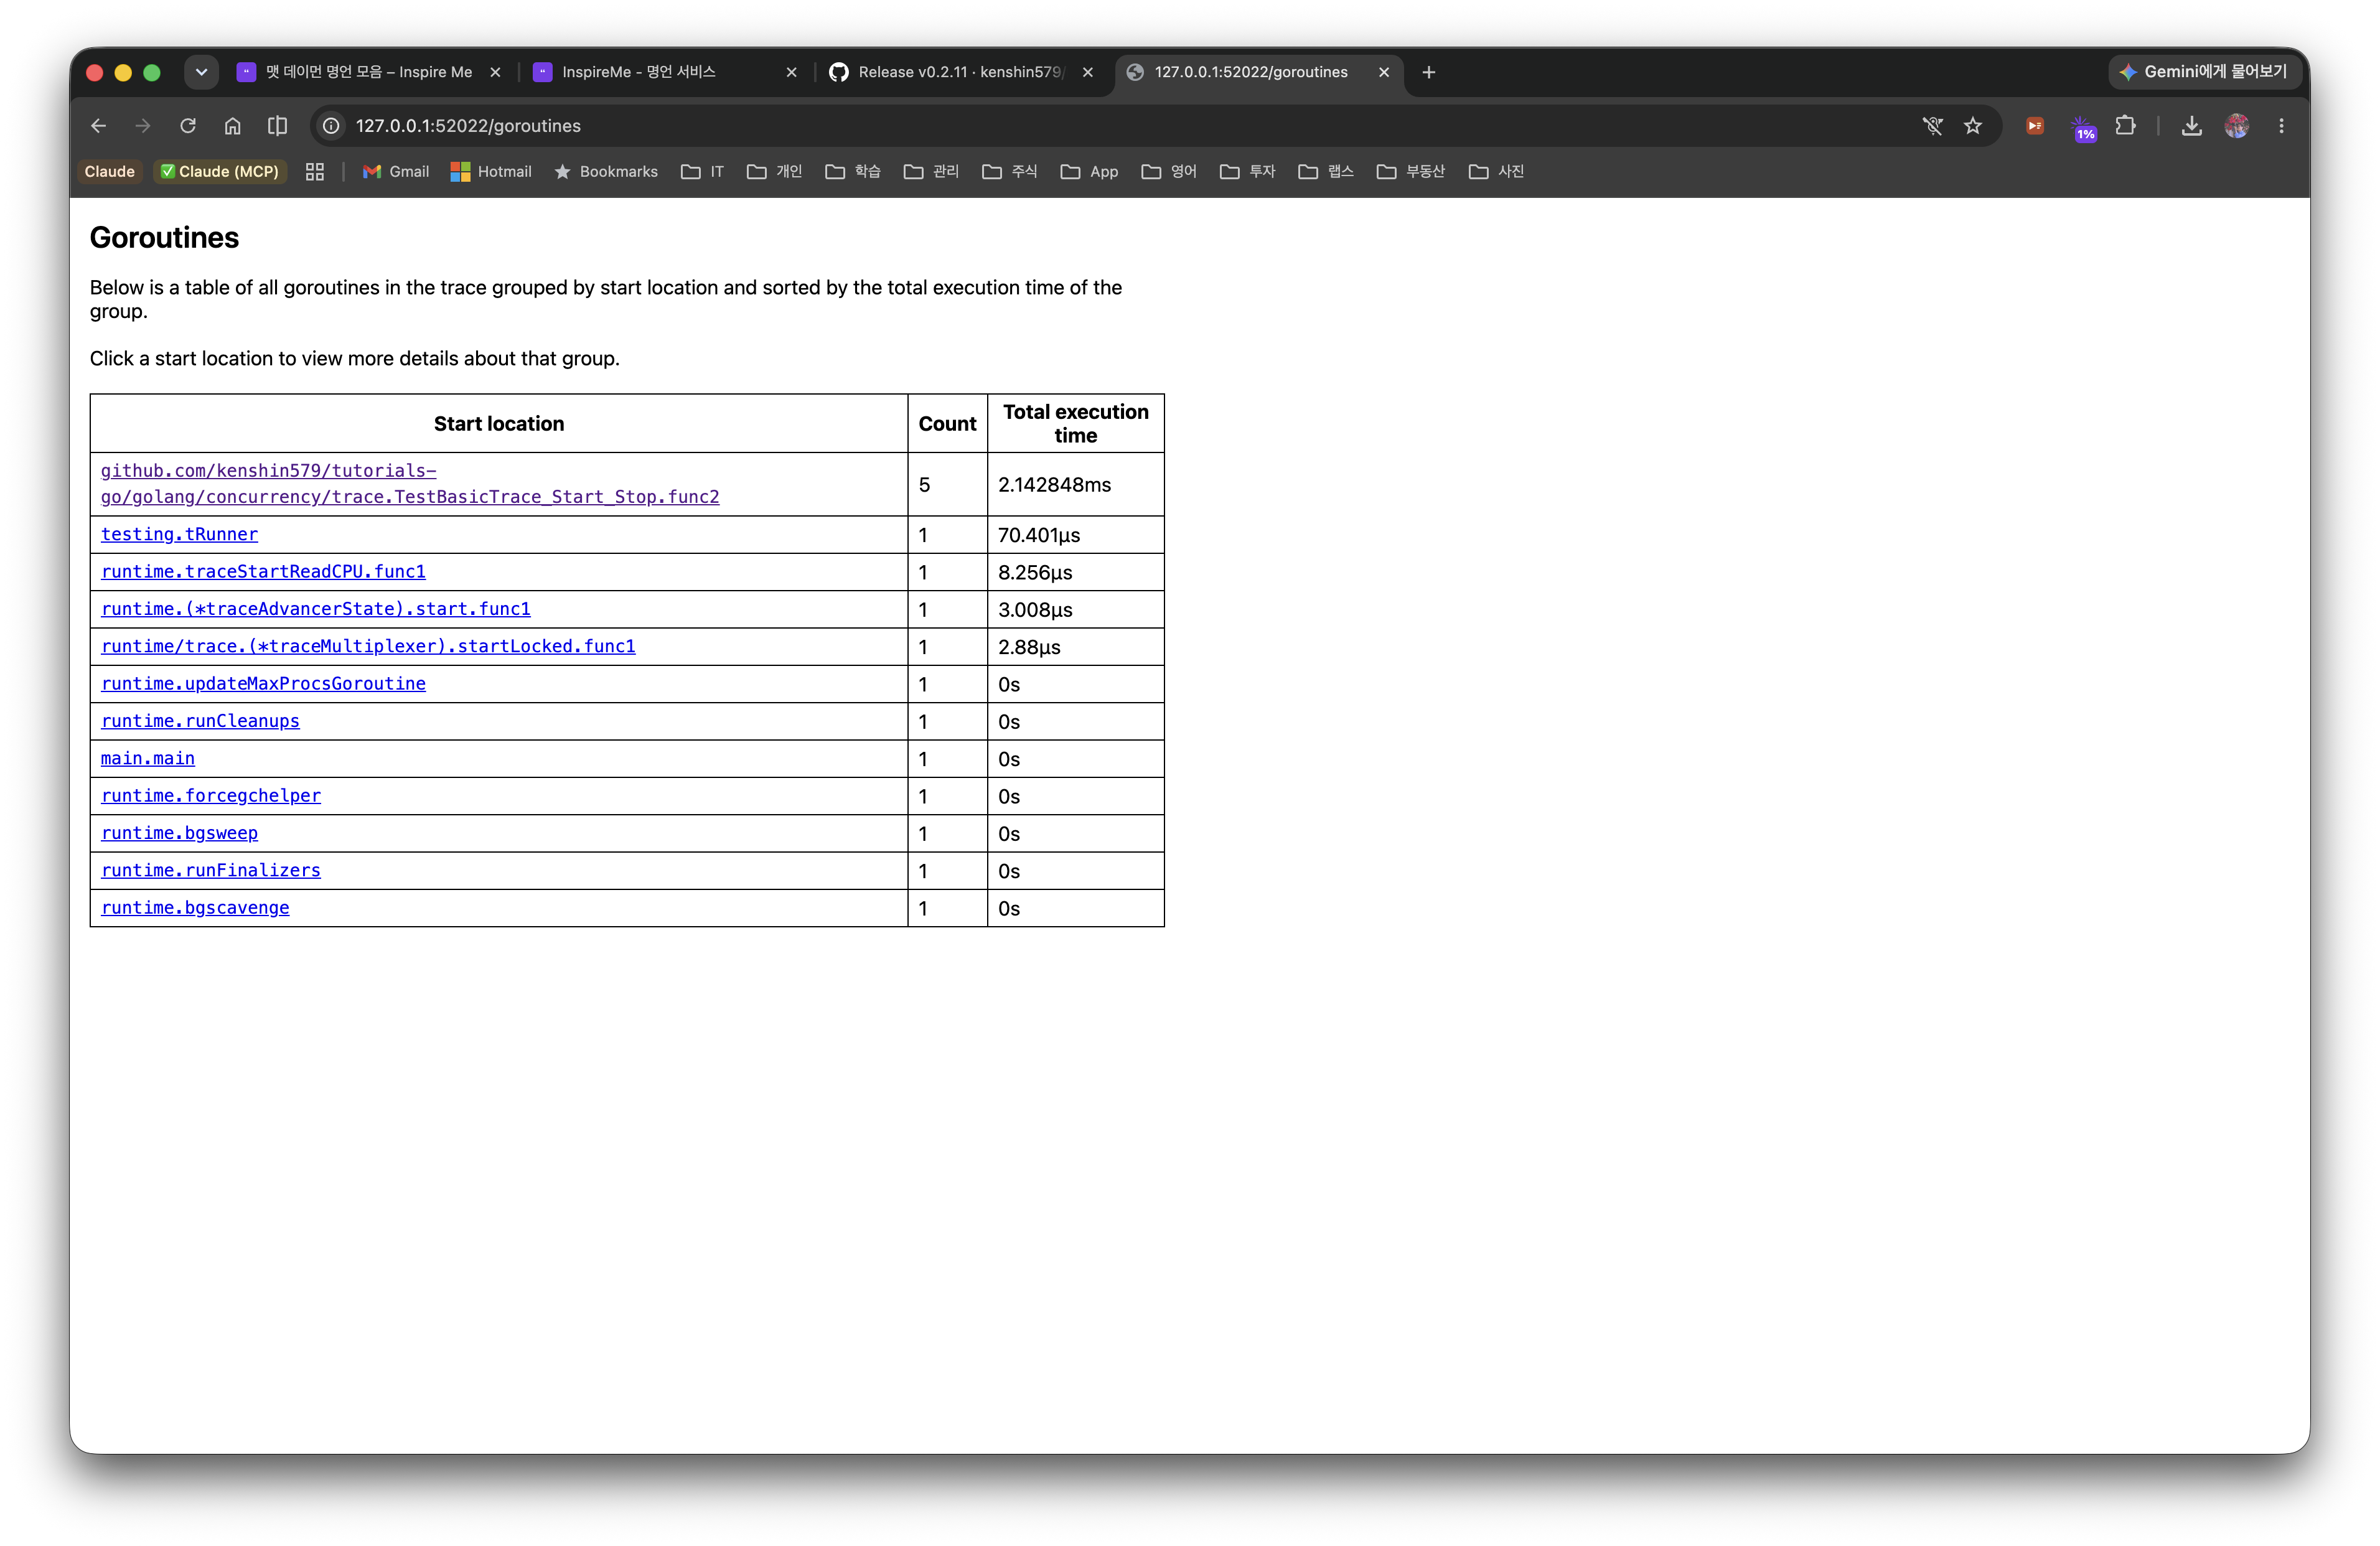
- Goroutines are grouped by start location, showing the count and total execution time.
- In this example,
...TestBasicTrace_Start_Stop.func2takes the largest share at Count 5, total 2.14ms → meaning the 5 workers we launched did most of the work. The remainingtesting.tRunnerandruntime.*are helper goroutines created by the test harness and the Go runtime. - Use which function's goroutines consume the most time to narrow down bottleneck candidates.
Detail — time breakdown per group
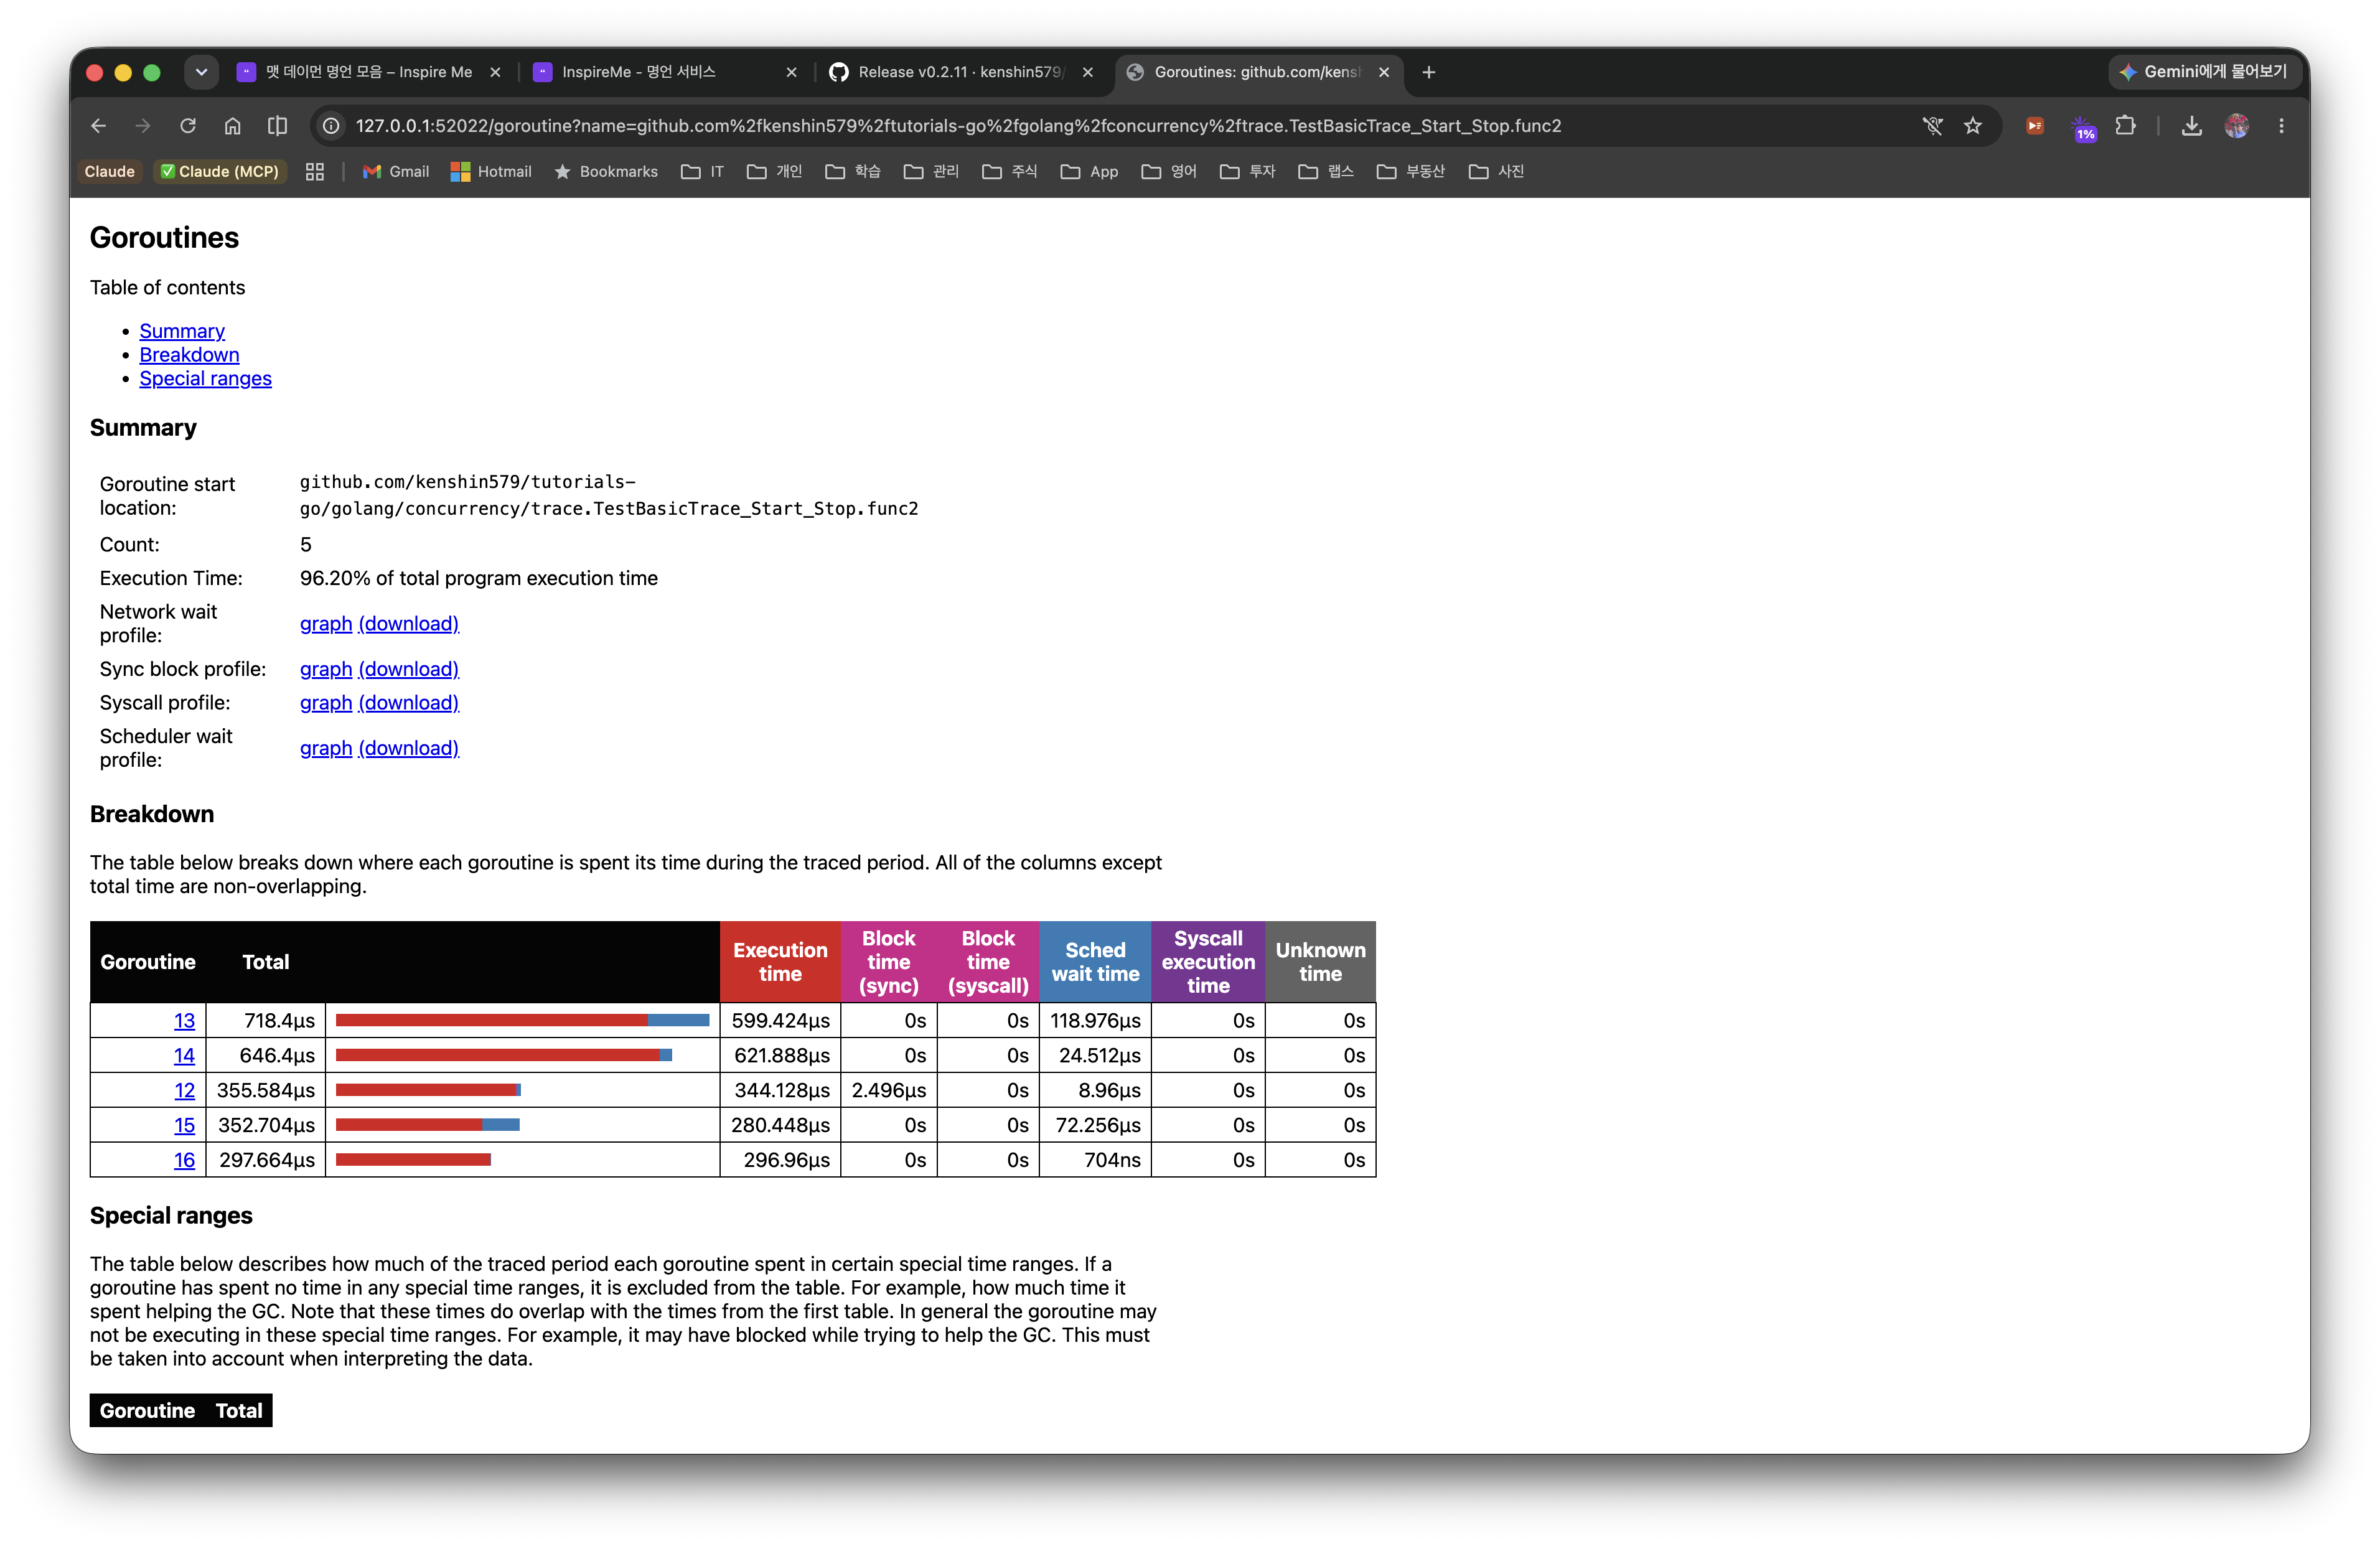
Clicking a group in the summary table breaks down, per goroutine, where the time was spent by category. This group accounts for 86.20% of the entire program's execution time.
- Execution: actual CPU execution time (here an overwhelming 86% → a textbook CPU-bound workload)
- Network wait: waiting on network I/O
- Sync block: waiting on synchronization such as mutexes and channels (close to 0 here — no contention beyond
WaitGroup) - Blocking syscall: blocking on a system call
- Scheduler wait: time spent runnable but waiting for a P (a large value means P scarcity or scheduling contention)
A high Execution share is a target for computation/algorithm optimization, a large Sync block calls for rethinking the lock design, and a large Scheduler wait suggests tuning GOMAXPROCS or the number of goroutines.
3.3 Blocking Profiles
This shows blocking profiles by Network / Synchronization / Syscall as pprof-style graphs. You can see which functions cause the most blocking, in the form of a call graph.
3.4 Scheduler Latency Profile
This shows the distribution of wait time from when a goroutine becomes runnable until it actually runs on a P. If scheduler latency is high, consider increasing GOMAXPROCS or reducing the number of goroutines.
4. User-Defined Tasks and Regions
The basic trace alone enables goroutine-level analysis, but for business-logic-level analysis you need Task, Region, and Log. Before diving in, here is a quick summary of the three terms.
- Task: a logical unit of work spanning multiple goroutines. A container that ties one flow together, like "order processing". (
trace.NewTask) - Region: a unit that measures the execution time of a specific section within a single goroutine. Inside a Task it carves out sub-sections such as "DB lookup" or "validation". (
trace.WithRegion/trace.StartRegion) - Log: a marking that records an event in key-value form at a specific point on the trace timeline. It is not a measurement but a record of "what happened at this moment". (
trace.Log)
To summarize all three in one sentence: a Task ties work together, a Region measures a section, and a Log marks a moment.
4.1 Task: a Logical Unit of Work
A Task ties a logical task spanning multiple goroutines into one. For example, even if the DB lookup, payment, and notification within an "order processing" Task each run in different goroutines, they can be tracked as a single Task.
ctx, task := rttrace.NewTask(ctx, "order-process")
defer task.End()
rttrace.Log(ctx, "orderID", "ORD-0001")
In go tool trace you can see a latency histogram per Task, making it easy to identify which kind of work is slow.
4.2 Region: Measuring a Section
A Region measures the time of a specific section within a single goroutine. You can use it in two ways.
WithRegion (closure style)
rttrace.WithRegion(ctx, "fetch-data", func() {
    // The execution time of this section is recorded in the trace
    time.Sleep(2 * time.Millisecond)
    result = 42
})
StartRegion/End (manual style)
You can control a Region outside a closure as well, and it can be nested.
region := rttrace.StartRegion(ctx, "validation")
// Do the work
region.End()
4.3 Log: Marking Events
trace.Log records the state at a specific point on the trace timeline.
rttrace.Log(ctx, "request", "GET /api/users")
rttrace.Log(ctx, "cache", "HIT user-list")
4.4 How Task/Region/Log Work Together
sequenceDiagram
    participant Main as Main Goroutine
    participant W1 as Worker-1
    participant W2 as Worker-2

    Main->>Main: NewTask("order-process")
    Main->>W1: go fetchData(ctx)
    Main->>W2: go sendNotification(ctx)

    activate W1
    W1->>W1: WithRegion("fetch-data")
    W1->>W1: Log("db-query", "SELECT ...")
    W1->>W1: WithRegion("transform-data")
    deactivate W1

    activate W2
    W2->>W2: WithRegion("send-email")
    W2->>W2: Log("status", "sent")
    deactivate W2

    Main->>Main: task.End()
5. GODEBUG Scheduler Tracing
go tool trace enables precise analysis, but sometimes you want a quick look at the macro state of the scheduler. For that, use GODEBUG=schedtrace.
5.1 Basic Usage
GODEBUG=schedtrace=1000 ./myapp
The scheduler state is printed to stderr every 1 second (1000ms).
SCHED 0ms: gomaxprocs=12 idleprocs=10 threads=3 spinningthreads=1
  needspinning=0 idlethreads=0 runqueue=0
  [0 0 0 0 0 0 0 0 0 0 0 0]
5.2 Interpreting the Output Fields
| Field | Meaning |
|---|---|
gomaxprocs | the GOMAXPROCS value (number of P's) |
idleprocs | the number of idle P's |
threads | the number of OS threads (M) |
spinningthreads | the number of M's looking for a goroutine to run |
runqueue | the number of goroutines in the global run queue |
[...] | the number of goroutines in each P's local run queue |
5.3 scheddetail=1 Detailed Output
GODEBUG=schedtrace=1000,scheddetail=1 ./myapp
The detailed state of each P, M, and G is printed.
- P line:
status(idle/running/syscall),schedtick,syscalltick, local queue size - M line: P binding state, whether spinning, whether blocked
- G line: goroutine state, reason for waiting
5.4 Goroutine State Codes
| Code | Name | Meaning |
|---|---|---|
| 0 | _Gidle | just created, not yet initialized |
| 1 | _Grunnable | runnable, waiting in the queue |
| 2 | _Grunning | running on an M |
| 3 | _Gsyscall | executing a system call |
| 4 | _Gwaiting | blocked on a channel, mutex, etc. |
5.5 Testing with a subprocess
Since the GODEBUG environment variable is only applied at process startup, tests verify it by launching a subprocess via os/exec.
func TestSchedtrace_GODEBUG_출력_파싱(t *testing.T) {
    if os.Getenv("SCHEDTRACE_HELPER") == "1" {
        // helper process: create goroutines to trigger scheduler activity
        var wg sync.WaitGroup
        for range 50 {
            wg.Add(1)
            go func() {
                defer wg.Done()
                sum := 0
                for range 100_000 {
                    sum++
                }
            }()
        }
        wg.Wait()
        return
    }

    // main test: run the helper as a subprocess
    cmd := exec.Command(os.Args[0],
        "-test.run=TestSchedtrace_GODEBUG_출력_파싱",
        "-test.v",
    )
    cmd.Env = append(os.Environ(),
        "SCHEDTRACE_HELPER=1",
        "GODEBUG=schedtrace=100",
    )

    output, err := cmd.CombinedOutput()
    outputStr := string(output)

    assert.NoError(t, err, "failed to run the subprocess")
    assert.Contains(t, outputStr, "SCHED", "schedtrace output should be present")
    assert.Contains(t, outputStr, "gomaxprocs=", "the gomaxprocs field should be present")
}
This is a pattern where, instead of t.Skip(), the test naturally branches into the subprocess-launch path when the SCHEDTRACE_HELPER=1 environment variable is absent. The helper process performs the actual workload only when SCHEDTRACE_HELPER=1 is set.
6. Flight Recorder (Go 1.25)
6.1 The Evolution of Go trace
Go's execution trace has been continuously improved.
| Version | Change |
|---|---|
| Go 1.21 | trace overhead reduced dramatically from 10-20% to 1-2% |
| Go 1.22 | new trace format introduced (partitioning, streaming, per-M batching) |
| Go 1.25 | runtime/trace.FlightRecorder officially included |
6.2 What the FlightRecorder Is
The FlightRecorder is a "black box recorder" that continuously collects a trace into a ring buffer and saves a snapshot when an anomaly occurs. Like an airplane's black box, it lets you analyze, after the fact, the situation just before a problem occurred.
flowchart LR
    A[Start FlightRecorder] --> B[Collect trace into ring buffer]
    B --> C{Anomaly detected?}
    C -- No --> B
    C -- Yes --> D[Save snapshot with WriteTo]
    D --> E[Analyze with go tool trace]
    D --> B
6.3 The Basic API
fr := rttrace.NewFlightRecorder(rttrace.FlightRecorderConfig{
    MinAge:   200 * time.Millisecond,  // minimum retention time
    MaxBytes: 1 << 20,                 // maximum 1 MiB
})

fr.Start()
defer fr.Stop()

// Save a snapshot when an anomaly occurs
if latency > threshold {
    var buf bytes.Buffer
    fr.WriteTo(&buf)
}
MinAge: keep at least this much trace data in the ring bufferMaxBytes: the maximum size of the ring buffer. When exceeded, the oldest data is dropped first
6.4 Hands-on Example: Detecting HTTP Server Latency
The following example automatically captures a FlightRecorder snapshot when an HTTP server's response time exceeds a threshold.
func TestFlightRecorder_HTTP서버_Latency_감지(t *testing.T) {
    const latencyThreshold = 50 * time.Millisecond

    fr := rttrace.NewFlightRecorder(rttrace.FlightRecorderConfig{
        MinAge:   200 * time.Millisecond,
        MaxBytes: 1 << 20,
    })

    err := fr.Start()
    assert.NoError(t, err)
    defer fr.Stop()

    // server with variable response time
    requestCount := 0
    var mu sync.Mutex
    server := httptest.NewServer(http.HandlerFunc(func(w http.ResponseWriter, r *http.Request) {
        mu.Lock()
        count := requestCount
        requestCount++
        mu.Unlock()

        // simulate a slow response on every 5th request
        if count%5 == 4 {
            time.Sleep(80 * time.Millisecond)
        } else {
            time.Sleep(5 * time.Millisecond)
        }
        fmt.Fprintf(w, "request-%d", count)
    }))
    defer server.Close()

    // client: capture a snapshot when latency is exceeded
    var snapshots []int64
    client := server.Client()

    for i := range 10 {
        start := time.Now()
        resp, err := client.Get(server.URL)
        assert.NoError(t, err)
        io.Copy(io.Discard, resp.Body)
        resp.Body.Close()

        elapsed := time.Since(start)
        if elapsed > latencyThreshold {
            var buf bytes.Buffer
            n, _ := fr.WriteTo(&buf)
            snapshots = append(snapshots, n)
            t.Logf("snapshot captured! (size: %d bytes, latency: %v)", n, elapsed)
        }
    }

    assert.NotEmpty(t, snapshots, "a snapshot should be captured when latency is exceeded")
}
In production, save the result of fr.WriteTo to a file or upload it to object storage so you can analyze it later with go tool trace.
6.5 A Guide to Setting MinAge/MaxBytes
| Scenario | MinAge | MaxBytes | Description |
|---|---|---|---|
| Fast request analysis | 200ms | 1 MiB | a detailed trace of a single request |
| Batch job analysis | 5s | 10 MiB | tracking the full flow of a long job |
| Memory-constrained environment | 100ms | 512 KiB | minimal memory usage |
7. Third-Party Visualization Tools
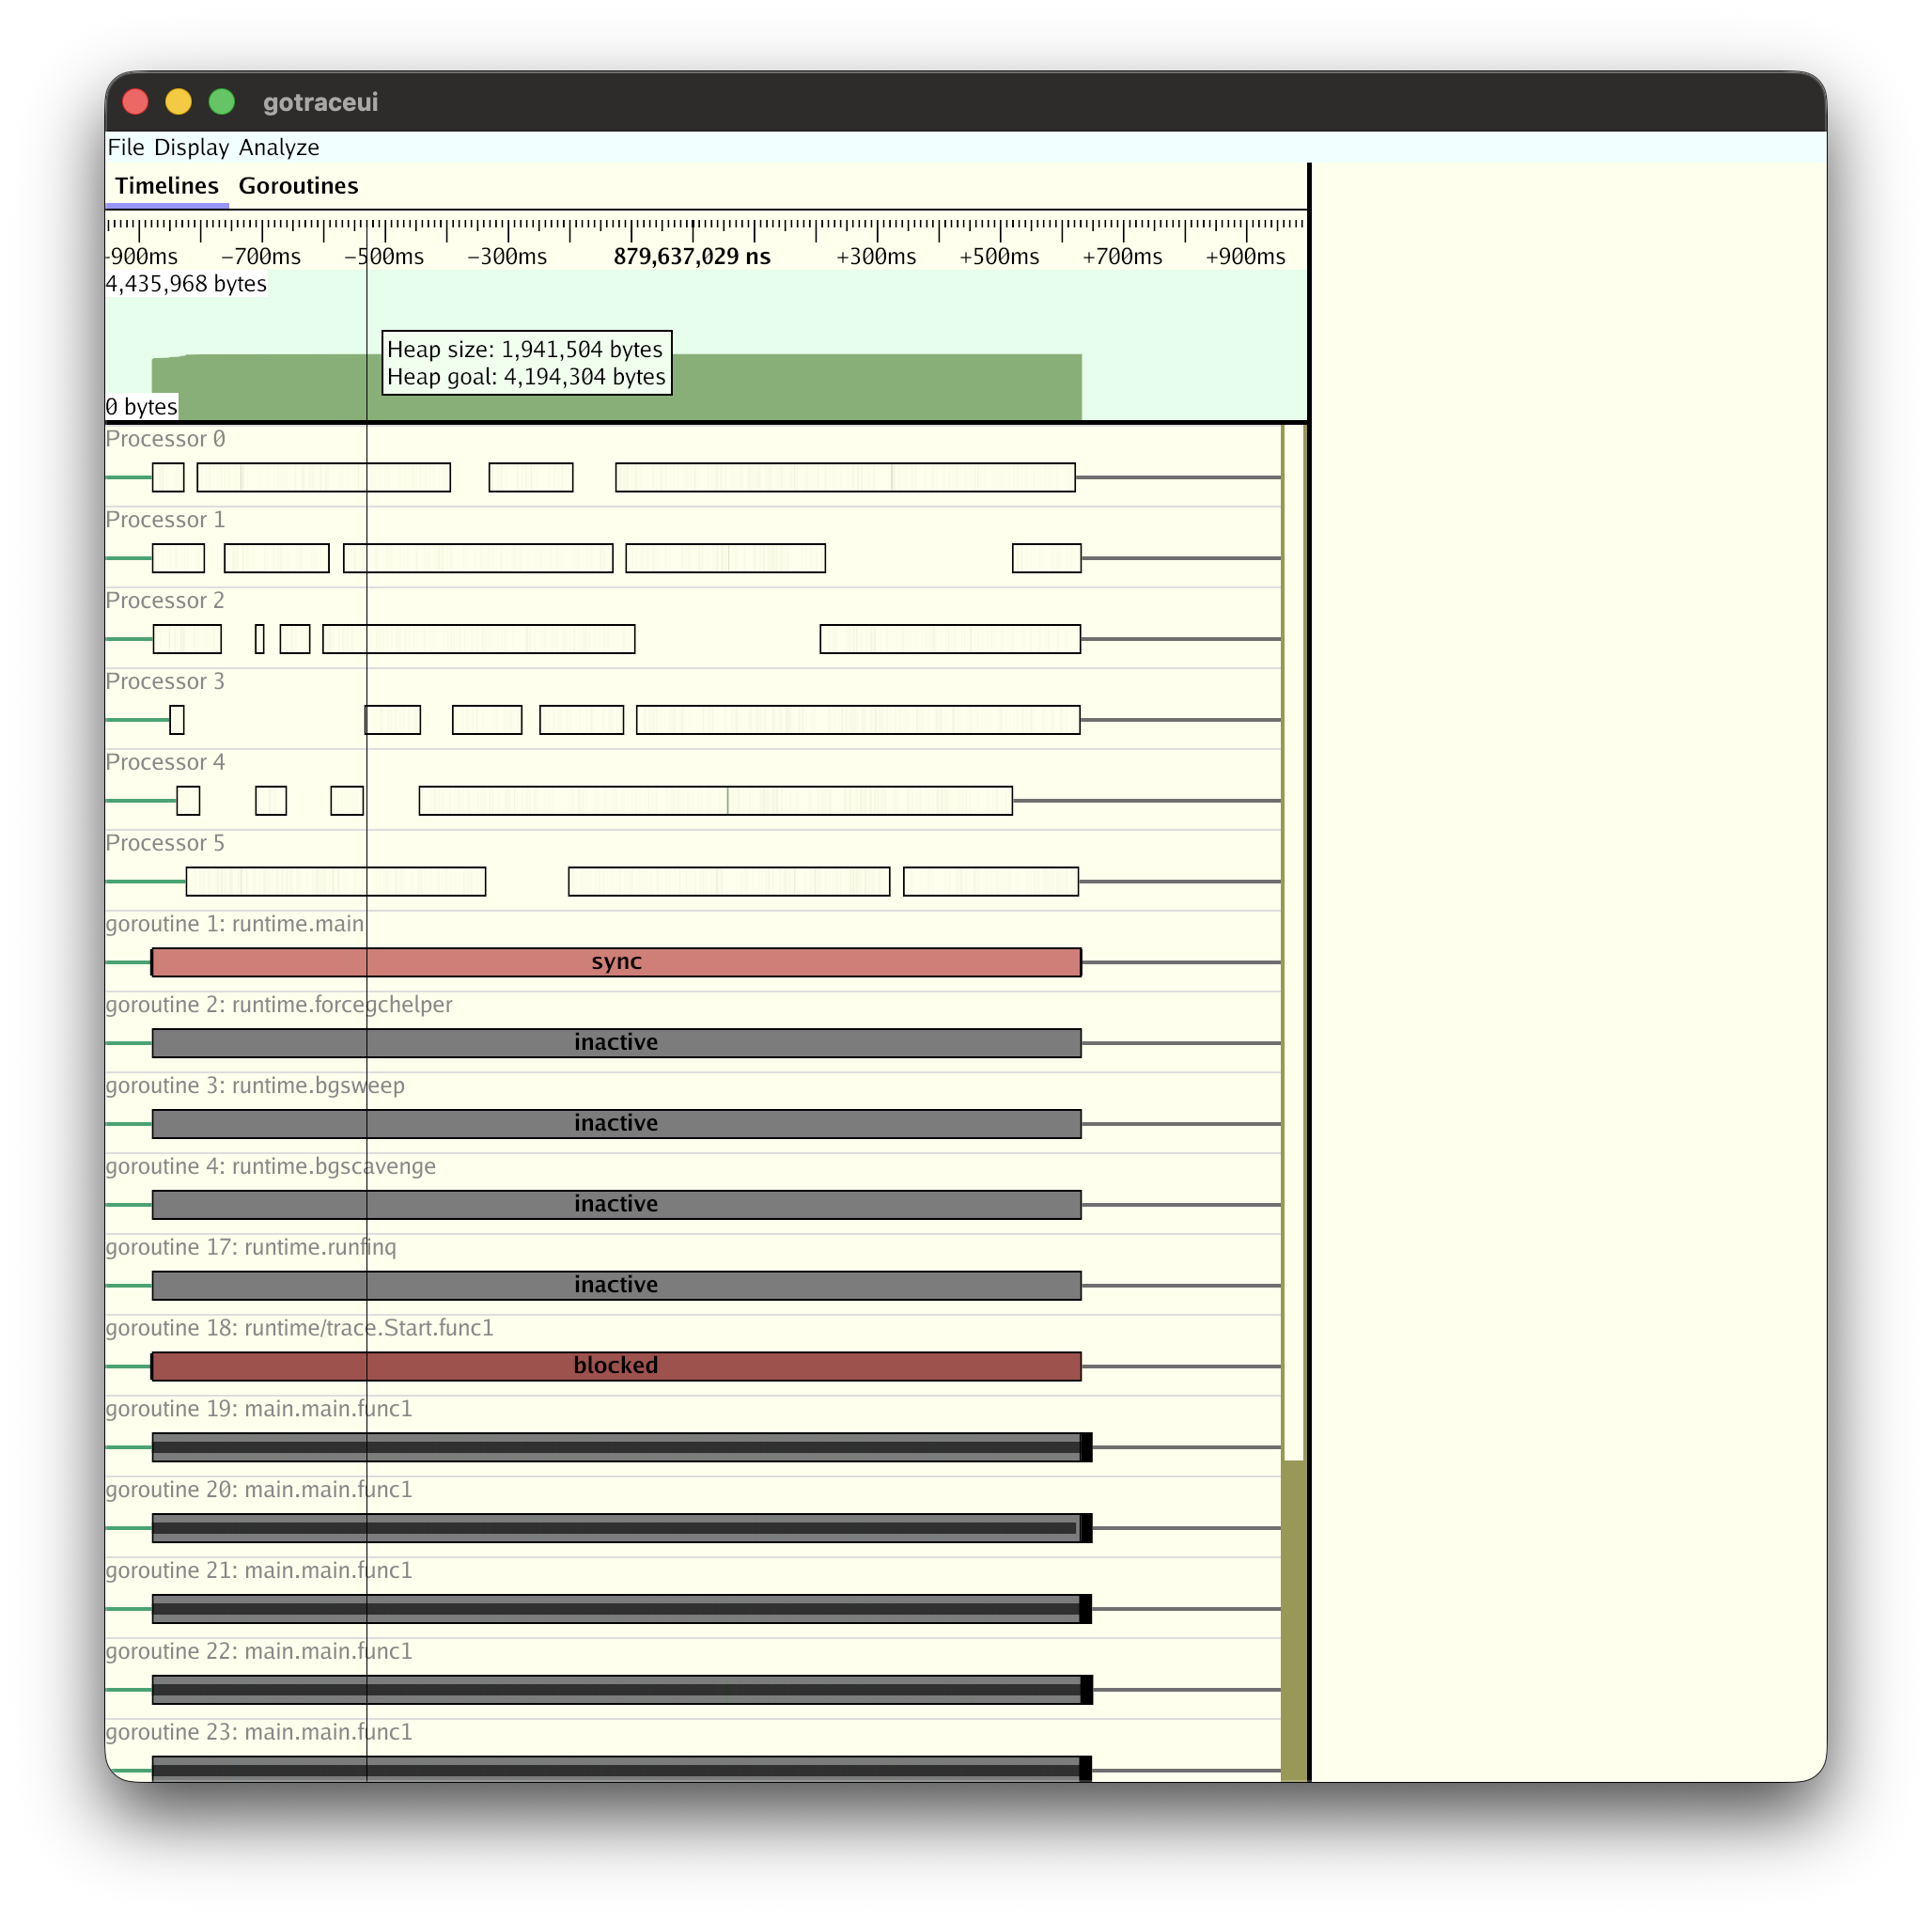
7.1 gotraceui (dominikh/gotraceui)
The web-based viewer of go tool trace depends on Chrome and can be slow with large traces. gotraceui is a native GUI viewer that replaces it.
Advantages:
- No Chrome dependency (a native app built on the Gio framework)
- Efficient handling of large traces
- Per-goroutine timeline, heatmaps, flame graphs
- CPU sample overlay
Installation and usage:
go install honnef.co/go/gotraceui/cmd/gotraceui@latest
gotraceui trace.out
When you actually open a worker pool trace, the per-Processor and per-goroutine timelines and execution states (sync, blocked, inactive) are visible at a glance.
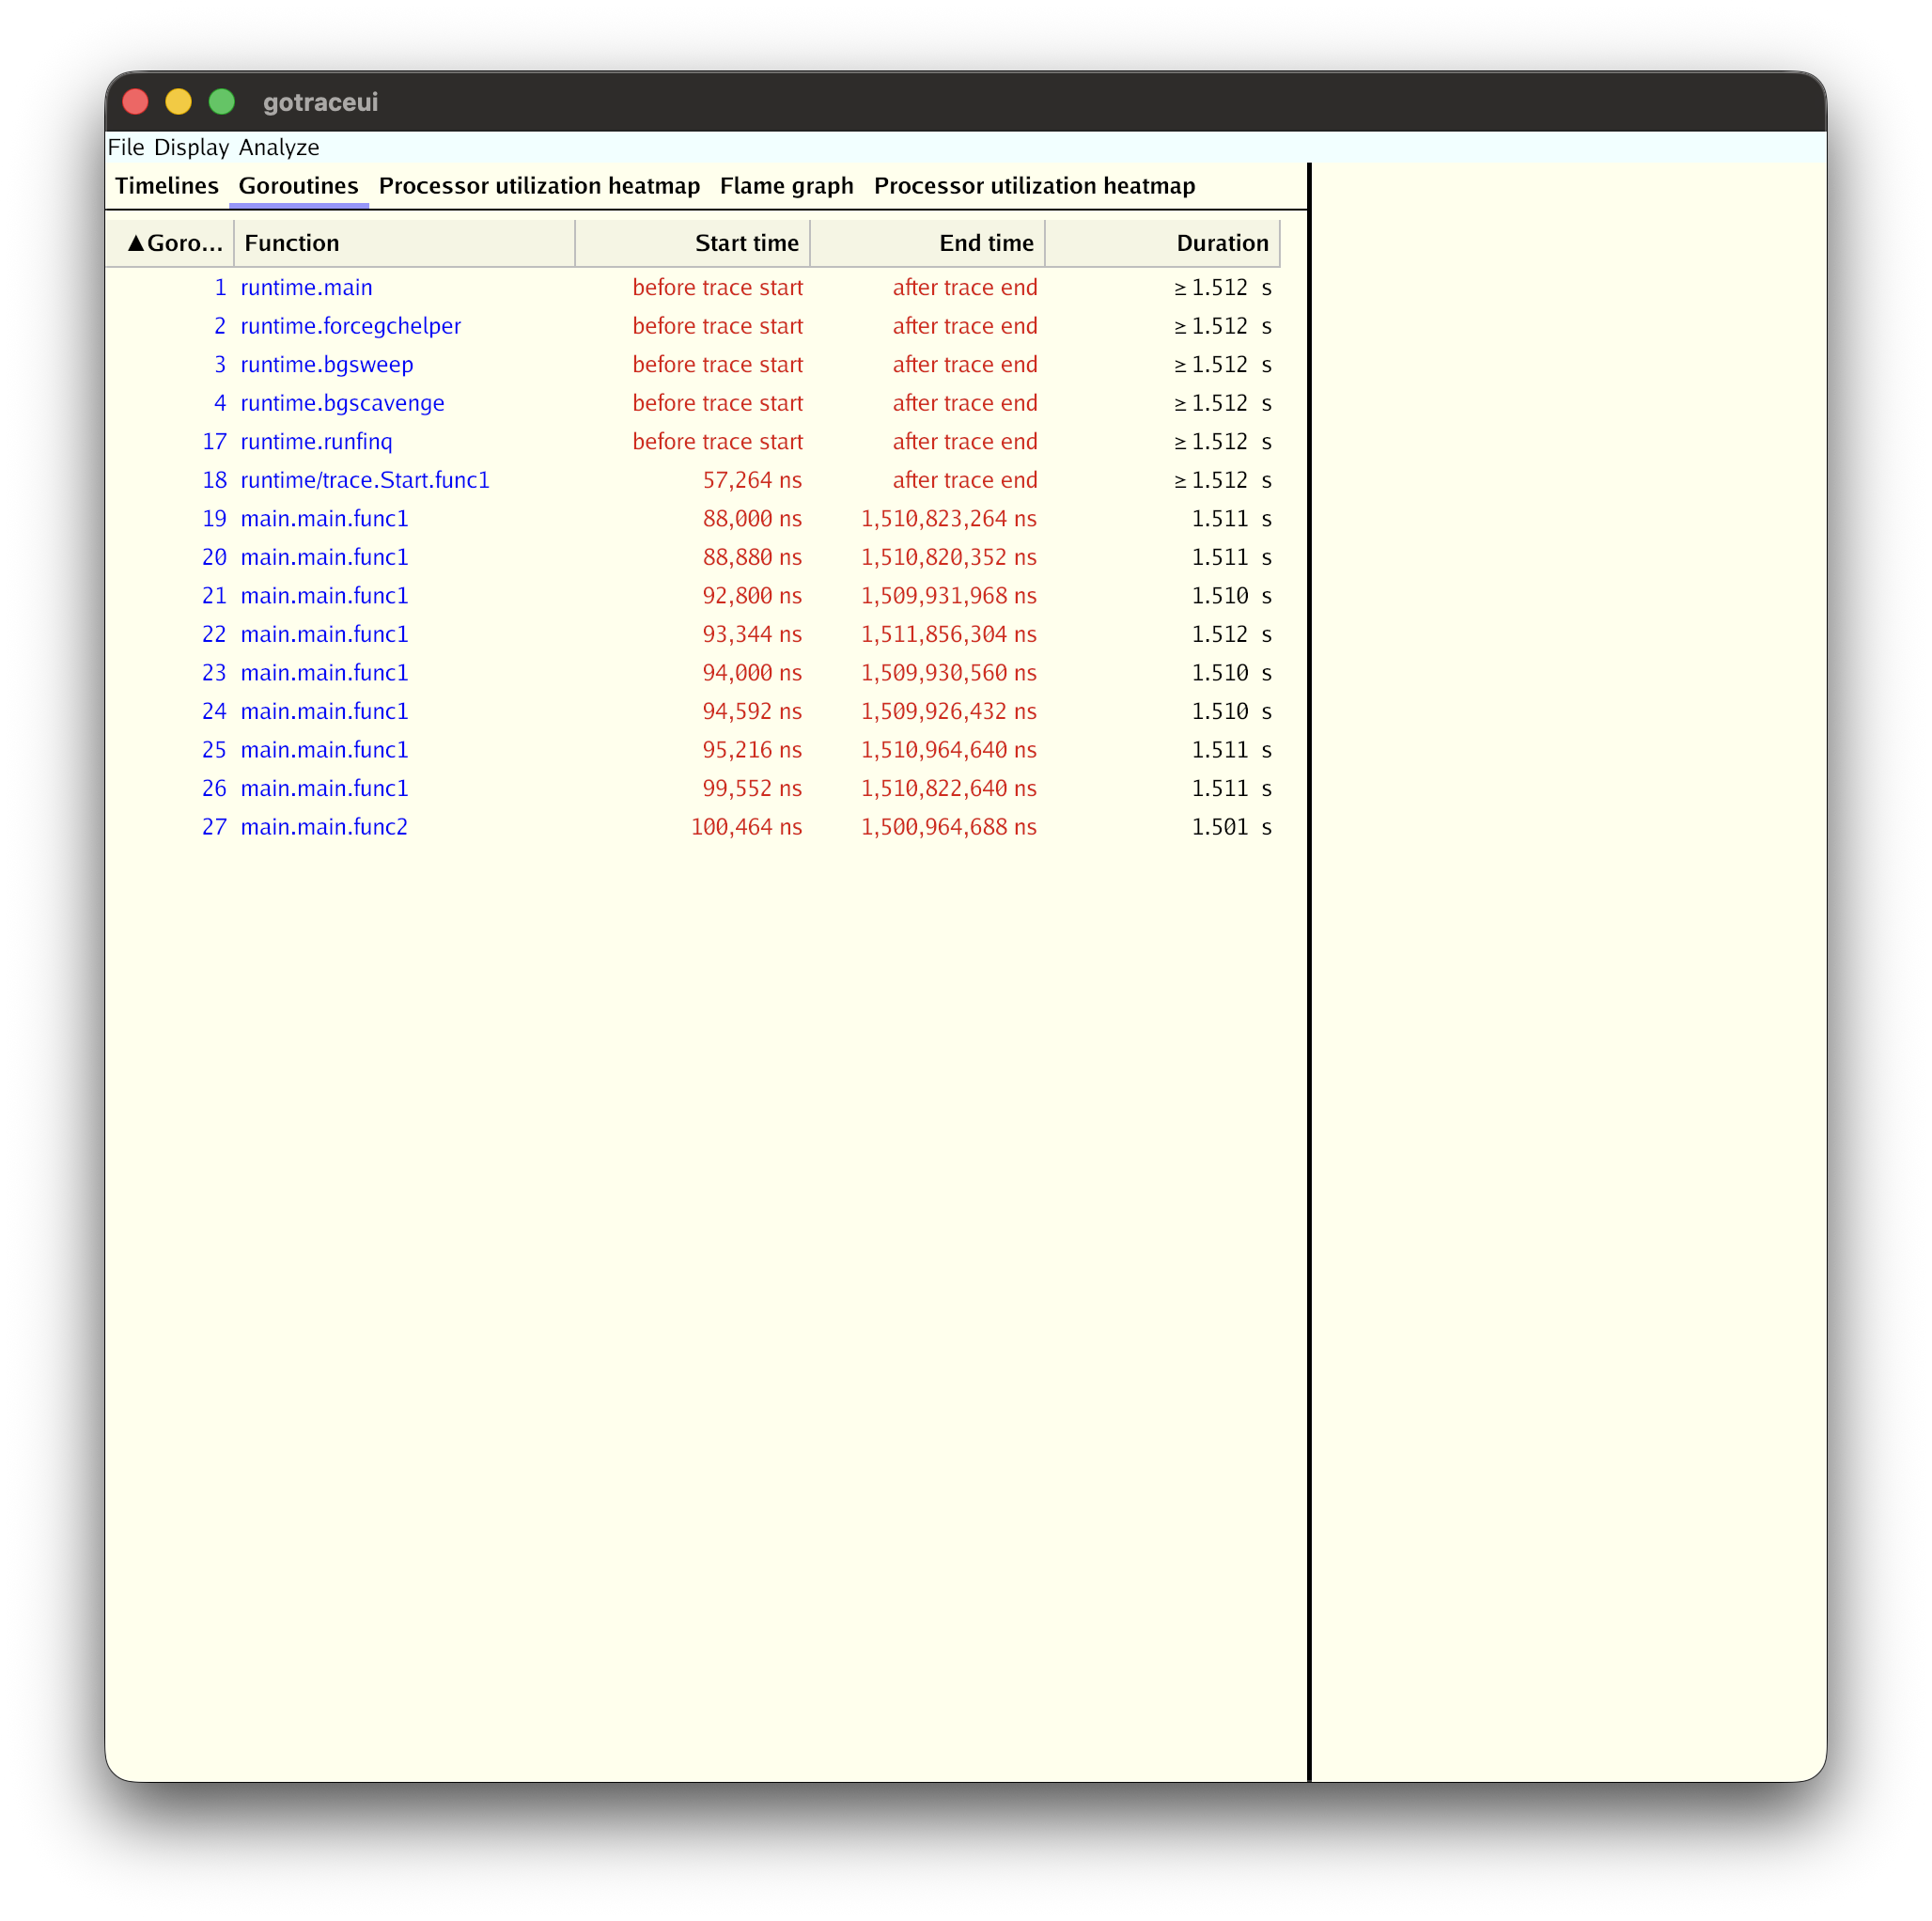
In the Goroutines tab you can see each goroutine's start/end times and execution time in a table.
Memory requirement: about 30x the trace file size. A 100MB trace → about 3GB of RAM needed.
⚠️ Caution about trace format version compatibility: The latest gotraceui release (v0.4.0) supports only the old trace format of Go 1.21 and earlier. As discussed in Section 2, the trace format was redesigned in Go 1.22, but gotraceui cannot yet read this new format, so opening a trace generated with a recent Go produces an
unsupported trace file versionerror. It also rejects short traces that end after a few milliseconds withtrace too short. So to analyze with gotraceui you need a trace from a program built with Go 1.21 that runs for at least a few hundred ms. If you use a recent Go, use the official viewergo tool trace, which supports the new format, or wait for a gotraceui release that supports the new format.
7.2 divan/gotrace (Educational 3D Visualization)
This visualizes goroutines and channel communication as WebGL-based 3D animations.
- blue lines = goroutine lifecycles
- red arrows = message passing over channels
It is suitable for educational purposes because you can intuitively understand concurrency patterns like fan-in, fan-out, and worker pools. However, it requires a patched old Go runtime (a Docker image) modified to also record channel events, and it can only visualize short programs.
⚠️ Currently not runnable: maintenance stopped after 2016, so it does not work in today's environment. The Go version of the official Docker image (1.8) and the trace parser built into the tool (which only handles the
go 1.5 traceformat) are mismatched, producing anot a trace fileerror, and binaries built with the old runtime also do not run on recent macOS. So treat the content below as a conceptual reference only, and if you need actual visualization, usego tool traceor gotraceui.
8. Combining pprof and trace
8.1 pprof vs trace
| Aspect | pprof | trace |
|---|---|---|
| Question | "What consumes resources?" | "What happened, and in what order?" |
| Method | sampling (statistical) | full recording (precise) |
| Overhead | CPU profile ~5% | 1-2% (Go 1.21+) |
| Output | flame graph, top N | timeline, goroutine analysis |
| Strength | identifying CPU/memory hotspots | causality, timing, concurrency analysis |
8.2 The Combined Workflow
flowchart TD
    A[Performance problem occurs] --> B[Collect a pprof CPU profile]
    B --> C[Identify hotspot functions]
    C --> D[Collect a trace]
    D --> E[Analyze goroutine timing of that section]
    E --> F{Concurrency problem?}
    F -- mutex contention --> G[Optimize locks]
    F -- scheduling delay --> H[Tune GOMAXPROCS]
    F -- GC pause --> I[Optimize memory allocation]
    F -- I/O blocking --> J[Introduce async processing]
8.3 When trace Is Better Than pprof
- mutex contention between goroutines: pprof's mutex profile shows only the total contention time, but trace shows exactly which goroutine waited for a lock at which point in time
- scheduling latency: time spent runnable but waiting for a P is not visible in pprof
- impact of GC pauses: trace can show which goroutine's execution was halted by a GC STW
- channel communication patterns: data flow through channels and the possibility of deadlock can only be analyzed in trace
8.4 Concurrent Collection Example
You can collect a pprof CPU profile and a trace simultaneously.
func TestPprof_Trace_동시수집(t *testing.T) {
    _ = os.MkdirAll("tmp", 0o755)
    traceFile, _ := os.Create("tmp/trace_combo.out")
    defer traceFile.Close()

    cpuFile, _ := os.Create("tmp/cpu_combo.prof")
    defer cpuFile.Close()

    // start the trace + CPU profile simultaneously
    rttrace.Start(traceFile)
    pprof.StartCPUProfile(cpuFile)

    // run the workload...

    // stop collecting
    rttrace.Stop()
    pprof.StopCPUProfile()

    // analyze:
    // go tool trace tmp/trace_combo.out
    // go tool pprof tmp/cpu_combo.prof
}
8.5 HTTP pprof Endpoints
Adding import _ "net/http/pprof" automatically registers profiling endpoints on the default HTTP server.
| Endpoint | Description |
|---|---|
/debug/pprof/ | index (list of available profiles) |
/debug/pprof/profile | CPU profile (default 30 seconds) |
/debug/pprof/trace | execution trace (default 1 second) |
/debug/pprof/heap | memory allocation profile |
/debug/pprof/goroutine | goroutine stack dump |
/debug/pprof/block | blocking profile |
/debug/pprof/mutex | mutex contention profile |
9. Hands-on Example: Tracing a Concurrent Web Crawler
Finally, we'll apply Task/Region/Log instrumentation to a simple web crawler based on the Worker Pool pattern and see what information we can get from the trace.
9.1 Crawler Structure
flowchart LR
    URLs[URL channel] --> W1[Worker 1]
    URLs --> W2[Worker 2]
    URLs --> W3[Worker 3]

    W1 --> R[Results channel]
    W2 --> R
    W3 --> R

    R --> Collect[Collect results]

    subgraph "Each Worker's processing flow"
        direction TB
        F[http-fetch Region] --> P[parse-html Region]
    end
9.2 Instrumentation Code
func TestCrawler_Task_Region_계측(t *testing.T) {
    _ = os.MkdirAll("tmp", 0o755)
    f, _ := os.Create("tmp/trace_crawler.out")
    defer f.Close()

    rttrace.Start(f)
    defer rttrace.Stop()

    // build a test with no external dependency using an httptest server
    pages := map[string]string{
        "/":        `<a href="/about">About</a><a href="/blog">Blog</a>`,
        "/about":   `<h1>About Us</h1><a href="/contact">Contact</a>`,
        "/blog":    `<h1>Blog</h1><a href="/blog/post1">Post 1</a>`,
        "/contact": `<h1>Contact</h1>`,
    }
    server := httptest.NewServer(http.HandlerFunc(func(w http.ResponseWriter, r *http.Request) {
        time.Sleep(time.Duration(len(r.URL.Path)) * time.Millisecond)
        if body, ok := pages[r.URL.Path]; ok {
            fmt.Fprint(w, body)
        } else {
            http.NotFound(w, r)
        }
    }))
    defer server.Close()

    ctx := context.Background()
    ctx, mainTask := rttrace.NewTask(ctx, "web-crawler")
    defer mainTask.End()

    results := crawl(ctx, server.URL, server.Client(), 3)
    assert.NotEmpty(t, results, "there should be crawling results")
}
Each Worker creates a Task whenever it receives a URL, and wraps the HTTP request and the parsing each in a Region.
for url := range urls {
    taskCtx, task := rttrace.NewTask(ctx, "crawl-page")
    rttrace.Log(taskCtx, "url", url)
    rttrace.Log(taskCtx, "worker", workerName)

    // instrument each step with a Region
    rttrace.WithRegion(taskCtx, "http-fetch", func() {
        // HTTP request...
    })
    rttrace.WithRegion(taskCtx, "parse-html", func() {
        // HTML parsing...
    })

    task.End()
}
9.3 Running the Example
The code above is included as a test in the tutorials-go repository. The process of running it yourself to collect a trace and open it in the viewer is as follows.
# 1. Clone the repository and move into the trace example directory
git clone https://github.com/kenshin579/tutorials-go.git
cd tutorials-go/golang/concurrency/trace

# 2. Run the crawler test → creates tmp/trace_crawler.out
go test -v -run TestCrawler_Task_Region_계측

# 3. Open the collected trace in the official viewer (launches the browser automatically)
go tool trace tmp/trace_crawler.out
When the test passes, the tmp/trace_crawler.out file is created, and go tool trace starts a local web server and opens the trace viewer in the browser. If the browser does not open automatically, you can specify a port and connect directly.
go tool trace -http=:6060 tmp/trace_crawler.out # connect to http://localhost:6060
This example uses an
httptestserver, so it works without an external network. When you are done viewing the trace, stopgo tool tracewithCtrl+C.
9.4 Analysis Points in the trace
When you open the collected trace with go tool trace, the User-defined tasks and User-defined regions links on the index page give you direct access to business-logic-level analysis.
① Latency per Task — the User-defined tasks page shows a latency histogram per Task type.
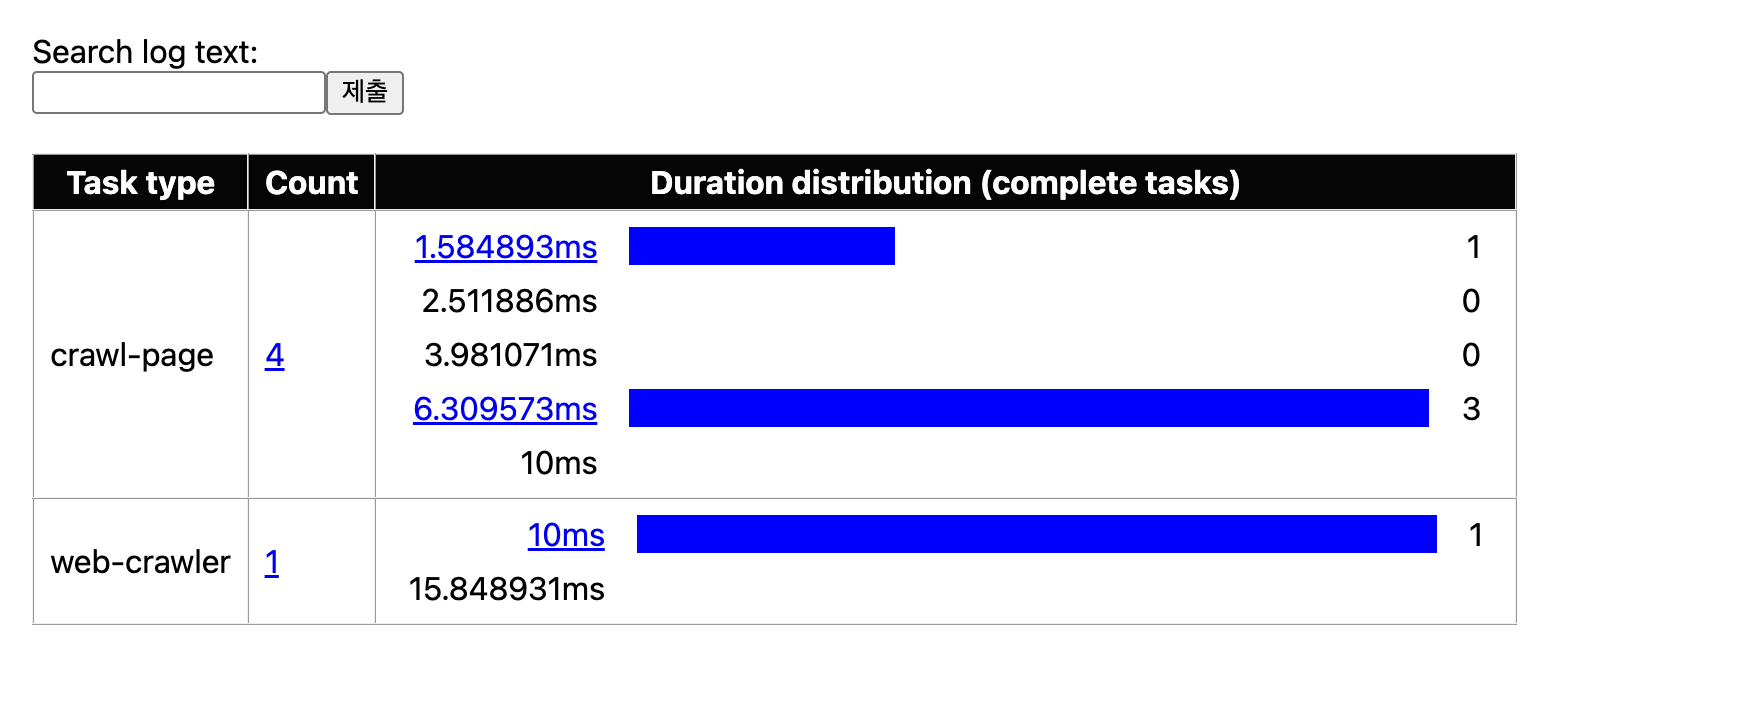
The crawl-page Task ran 4 times; one of them was around 1.5ms and three were clustered in the 6.3–10ms range. Because the test server in this example was built to delay responses in proportion to the URL path length, pages with longer paths appear slower. The web-crawler Task wrapping the entire crawl ran once and took 10–15.8ms.
② Comparing time per Region — on the User-defined regions page you can compare the http-fetch and parse-html sections side by side.
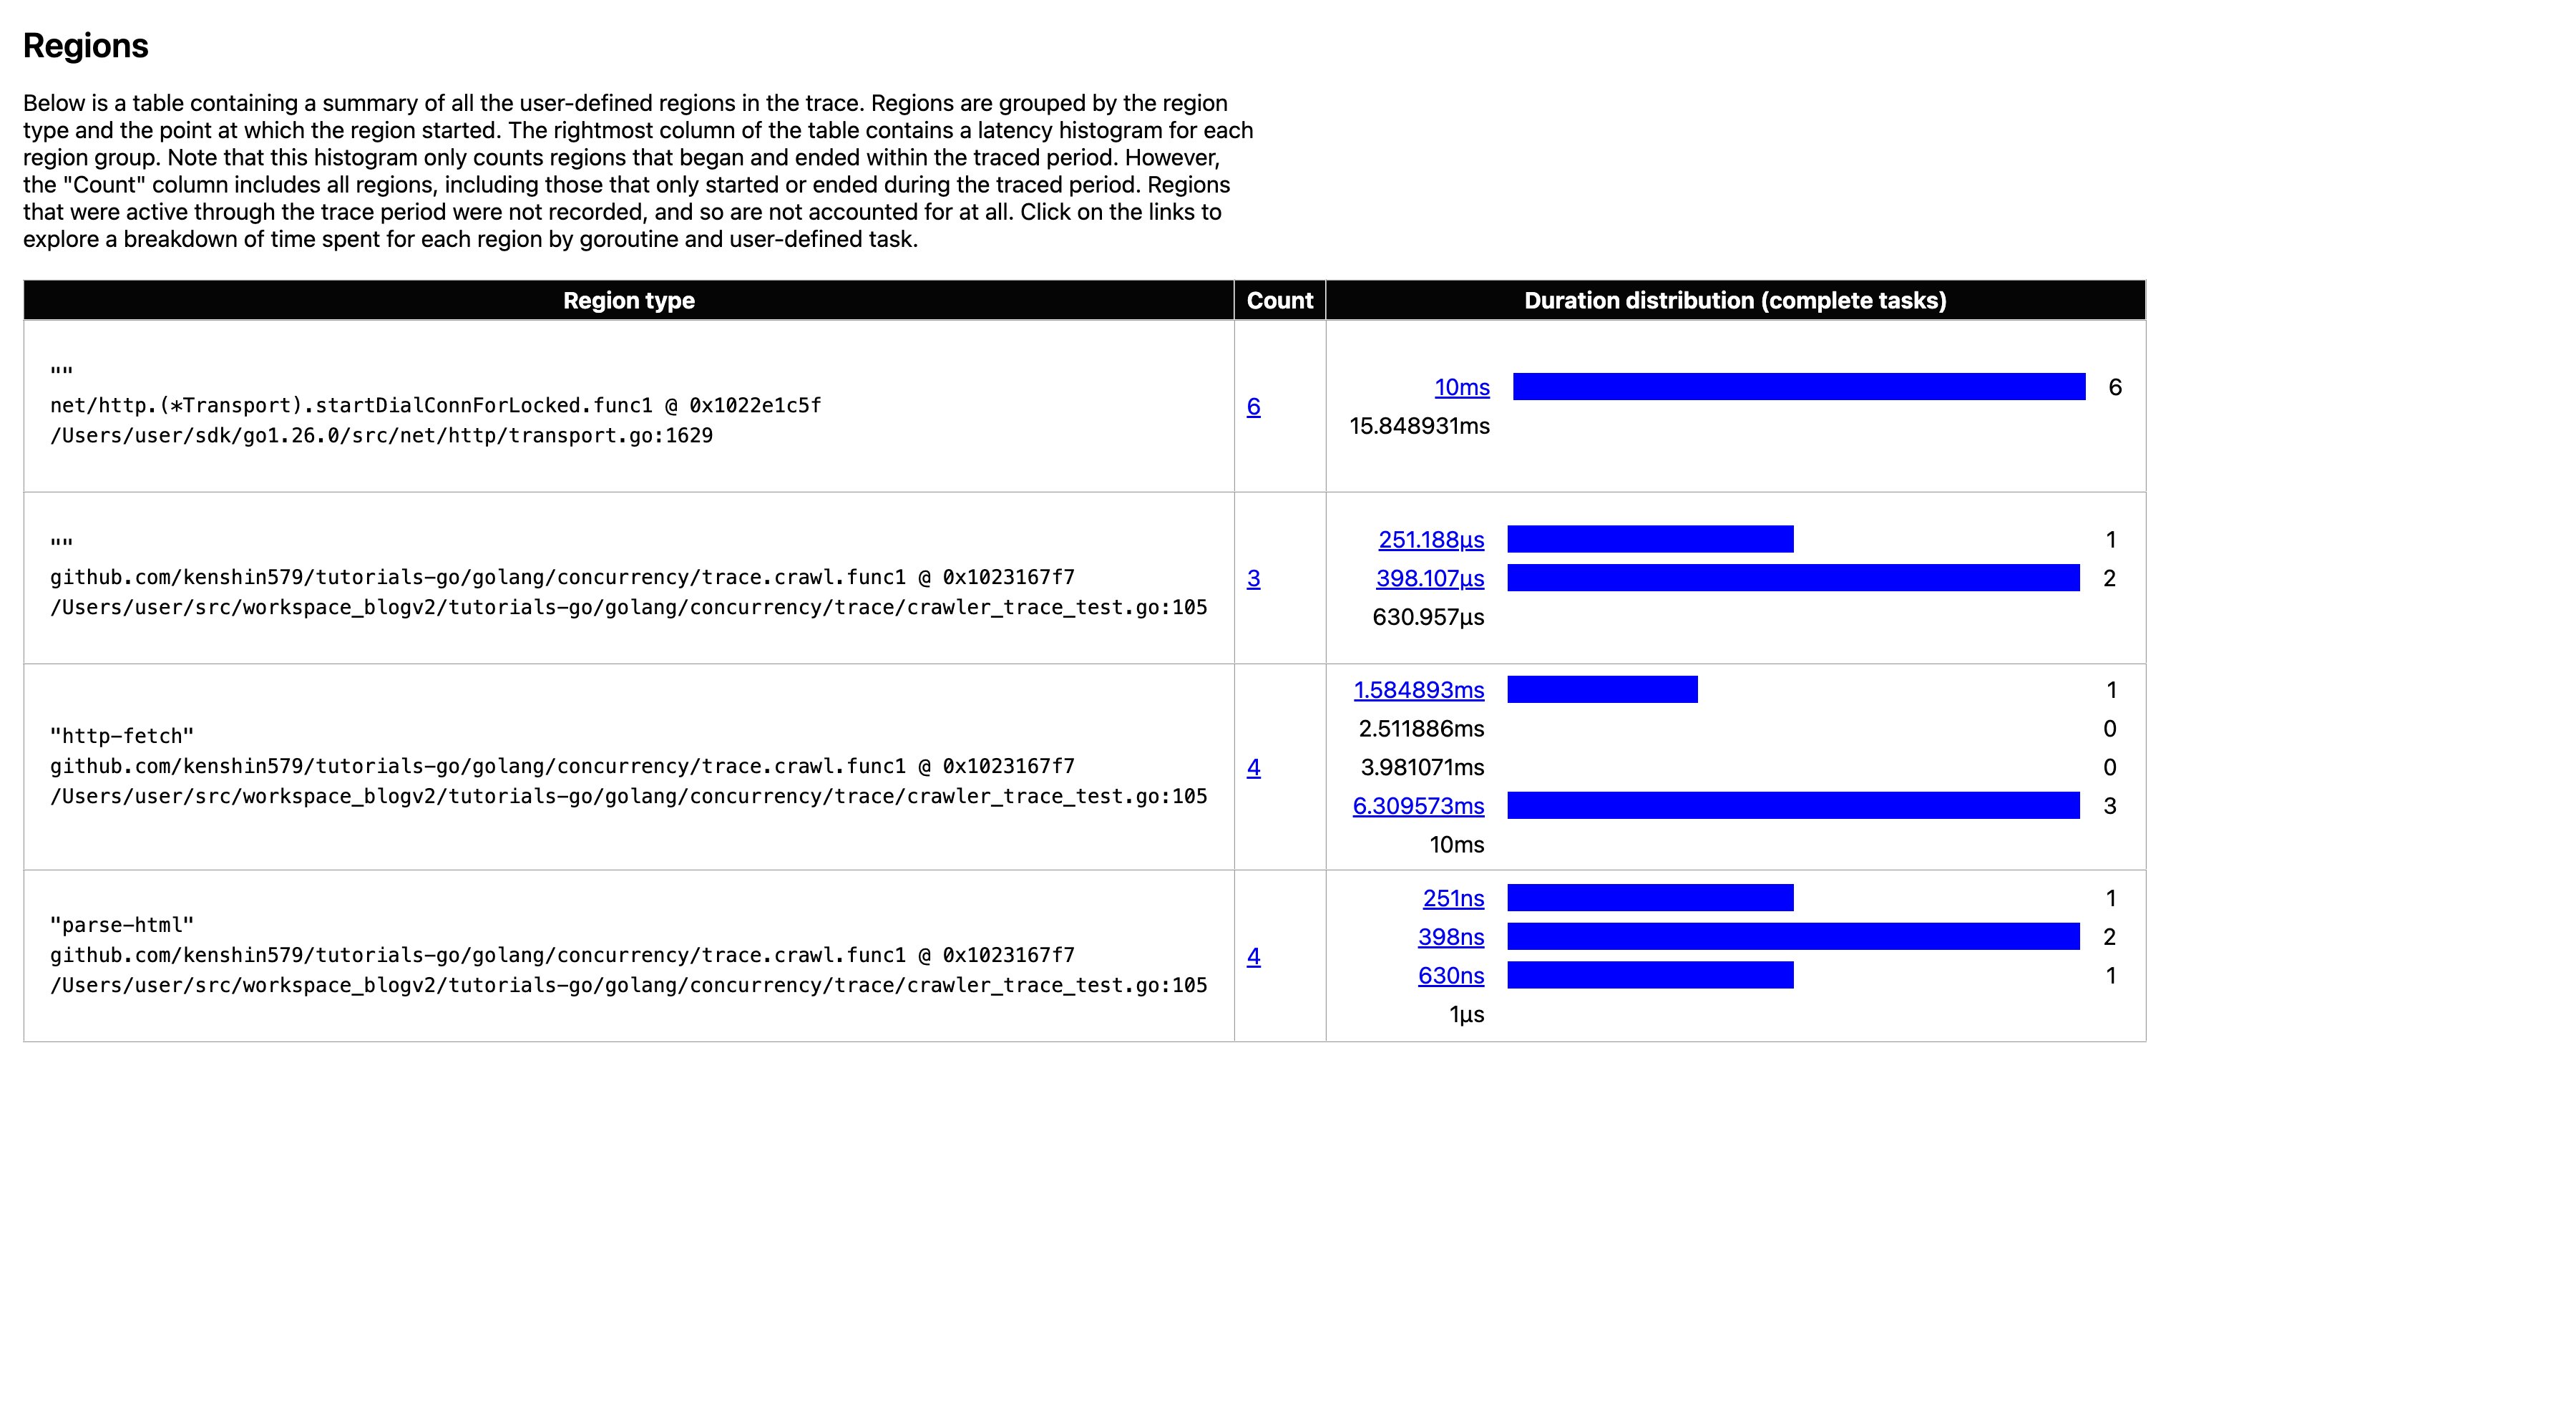
The result is clear. http-fetch is 1.5–10ms, whereas parse-html is only 251ns–1µs. In other words, almost all of the crawling time is spent on network I/O (http-fetch) and the parsing cost is negligible — you can conclude this just by looking at the trace. The conclusion follows immediately: if you optimize, you should work on the network side, such as the number of concurrent requests or connection reuse, not the parsing.
Beyond this, the following views are useful.
- Worker utilization: in
Goroutine analysis, check the ratio of time a Worker goroutine spends running versus waiting on a channel - Scheduling efficiency: in
Scheduler latency profile, check how long a Worker is runnable but waiting for a P
10. Summary
| Tool/Technique | Core idea | When to use |
|---|---|---|
trace.Start/Stop | precise section collection via code insertion | analyzing a specific section during development/testing |
go test -trace | collect a test trace without modifying code | quickly checking a trace from an existing test |
net/http/pprof | collect a runtime trace over HTTP | analyzing a running server |
| Task/Region/Log | business-logic-level instrumentation | analyzing the latency of a logical task |
GODEBUG=schedtrace | print the scheduler's macro state | a quick check of the scheduler state |
| Flight Recorder | automatic snapshot on an anomaly | debugging production tail latency |
| gotraceui | a GUI for analyzing large traces | analyzing large traces without Chrome |
| pprof + trace combo | CPU hotspots + concurrency causality | analyzing compound performance problems |
The performance problems and bugs in concurrent code are hard to solve with logs and guesswork alone. Make it a habit to analyze based on data using go tool trace. Now that trace overhead has dropped dramatically to 1-2% since Go 1.21, you can freely collect and inspect a trace whenever you suspect a bottleneck during the development and testing phases.
You can find the example code on GitHub.